
What Is Swing Trading?
Swing trading is a style of trading that holds a position for a few days to a few weeks. A swing trader aims to capture one move in a stock's price: a leg of a trend, or a move out of a sideways range. Decisions are made mostly from daily bars. Each bar is one session's open, high, low, close and volume. This guide explains the horizon, the charts and measurements swing traders commonly use, and where an end-of-day stock screen fits into the research.
What swing trading is
The defining feature is the holding period. A swing trade lasts longer than one session, so it is held overnight. That means it carries the risk of a gap at the next open. It is shorter than the months a position trader typically holds. Within those bounds there is no fixed rule, and two swing traders can work on quite different horizons.
How it differs from day trading and position trading
The three styles are usually told apart by how long a position is held and by how often the trader needs new data.
| Style | Typical holding period | Data most used | Charts most read |
|---|---|---|---|
| Day trading | Minutes to hours, closed within one session | Intraday bars and quotes | One-minute to hourly charts |
| Swing trading | A few days to a few weeks | End-of-day bars | Daily and weekly charts |
| Position trading | Months or longer | End-of-day and weekly bars | Weekly and monthly charts |
The table describes how the styles are commonly defined. It is not a ranking. Each style asks different things of a trader's time, data and tools, and this guide recommends none of them.
Daily and weekly charts
A daily chart draws one candle per session. Each candle shows where the stock opened, the highest and lowest prices it traded at, and where it closed. A few months of daily candles show the recent swings: the advances, the pullbacks and the sideways stretches between them.
A weekly chart draws one candle per week. It fits a year or more into the same width, so it shows the larger trend the daily swings sit inside. Swing traders commonly read the weekly chart for the direction of that trend and the daily chart for where price sits within it.
Moving averages are commonly laid over both. A moving average is the average close over a set number of sessions, so it smooths out the daily noise. Whether price sits above or below its 50-day average, and whether that average is rising, is a plain description of a trend.
Measuring liquidity: dollar volume
Liquidity is how easily a position can be opened and closed without moving the price. Dollar volume measures it. It is the closing price times the number of shares traded, which approximates the value that changed hands in a session. QM Screener averages it over the last 50 sessions and again over the last 20.
Share volume alone can mislead. A low-priced stock can trade many shares and very little value. The Momentum Continuation screen here requires an average dollar volume strictly above $20 million over 50 sessions and strictly above $10 million over 20. The second window catches a name whose trading has thinned in the last month while its 50-day figure still looks healthy.
Measuring volatility: ADR%
Volatility is how far a stock's price typically moves. A common swing-trading measure of it is ADR%, the average daily range. Here it is the mean of each session's high divided by its low over the last 20 sessions, minus one, expressed as a percent. A stock with an ADR% of 4 moves about 4 percent from its low to its high on an average day.
A stock that barely moves in a day can be in a clean trend and still make a small swing. The Momentum Continuation screen requires an ADR% strictly above 2.50%. The ADR% guide covers the formula, the floor each screen applies and the ceiling the setup score puts on it.
Relative strength
Relative strength (RS) compares a stock's performance with the rest of the market. Here it is the stock's three-month return, ranked as a percentile against every other screened stock. A percentile of 0 is the weakest return and 100 the strongest. An RS of 90 means the stock's three-month return was higher than that of 90 percent of the screened stocks.
Swing traders who follow momentum commonly look near the top of that ranking. The Momentum Continuation screen requires an RS percentile strictly above 85. How to screen for momentum stocks explains the ranking and the other criteria in full.
An end-of-day research routine
A swing trade is held for days, so the research can happen while the market is closed. A common routine runs after the close:
- Screen. A trader applies a set of rules to every stock, using the session's final bars, and gets a short list.
- Read the charts. The trader reads each name's daily and weekly charts: the trend, the moving averages and the recent range.
- Prepare for the next session. The trader notes the levels on each chart that matter to their own method, and saves the list.
QM Screener is built for the screening step of that routine. It runs seven screens over the full US stock market once per US trading day, after the close, on end-of-day bars. Every row carries its measured values, such as RS, ADR% and dollar volume. Every row opens a daily or weekly chart drawn from the same bars. Swing trading strategies compares the approaches those screens apply.
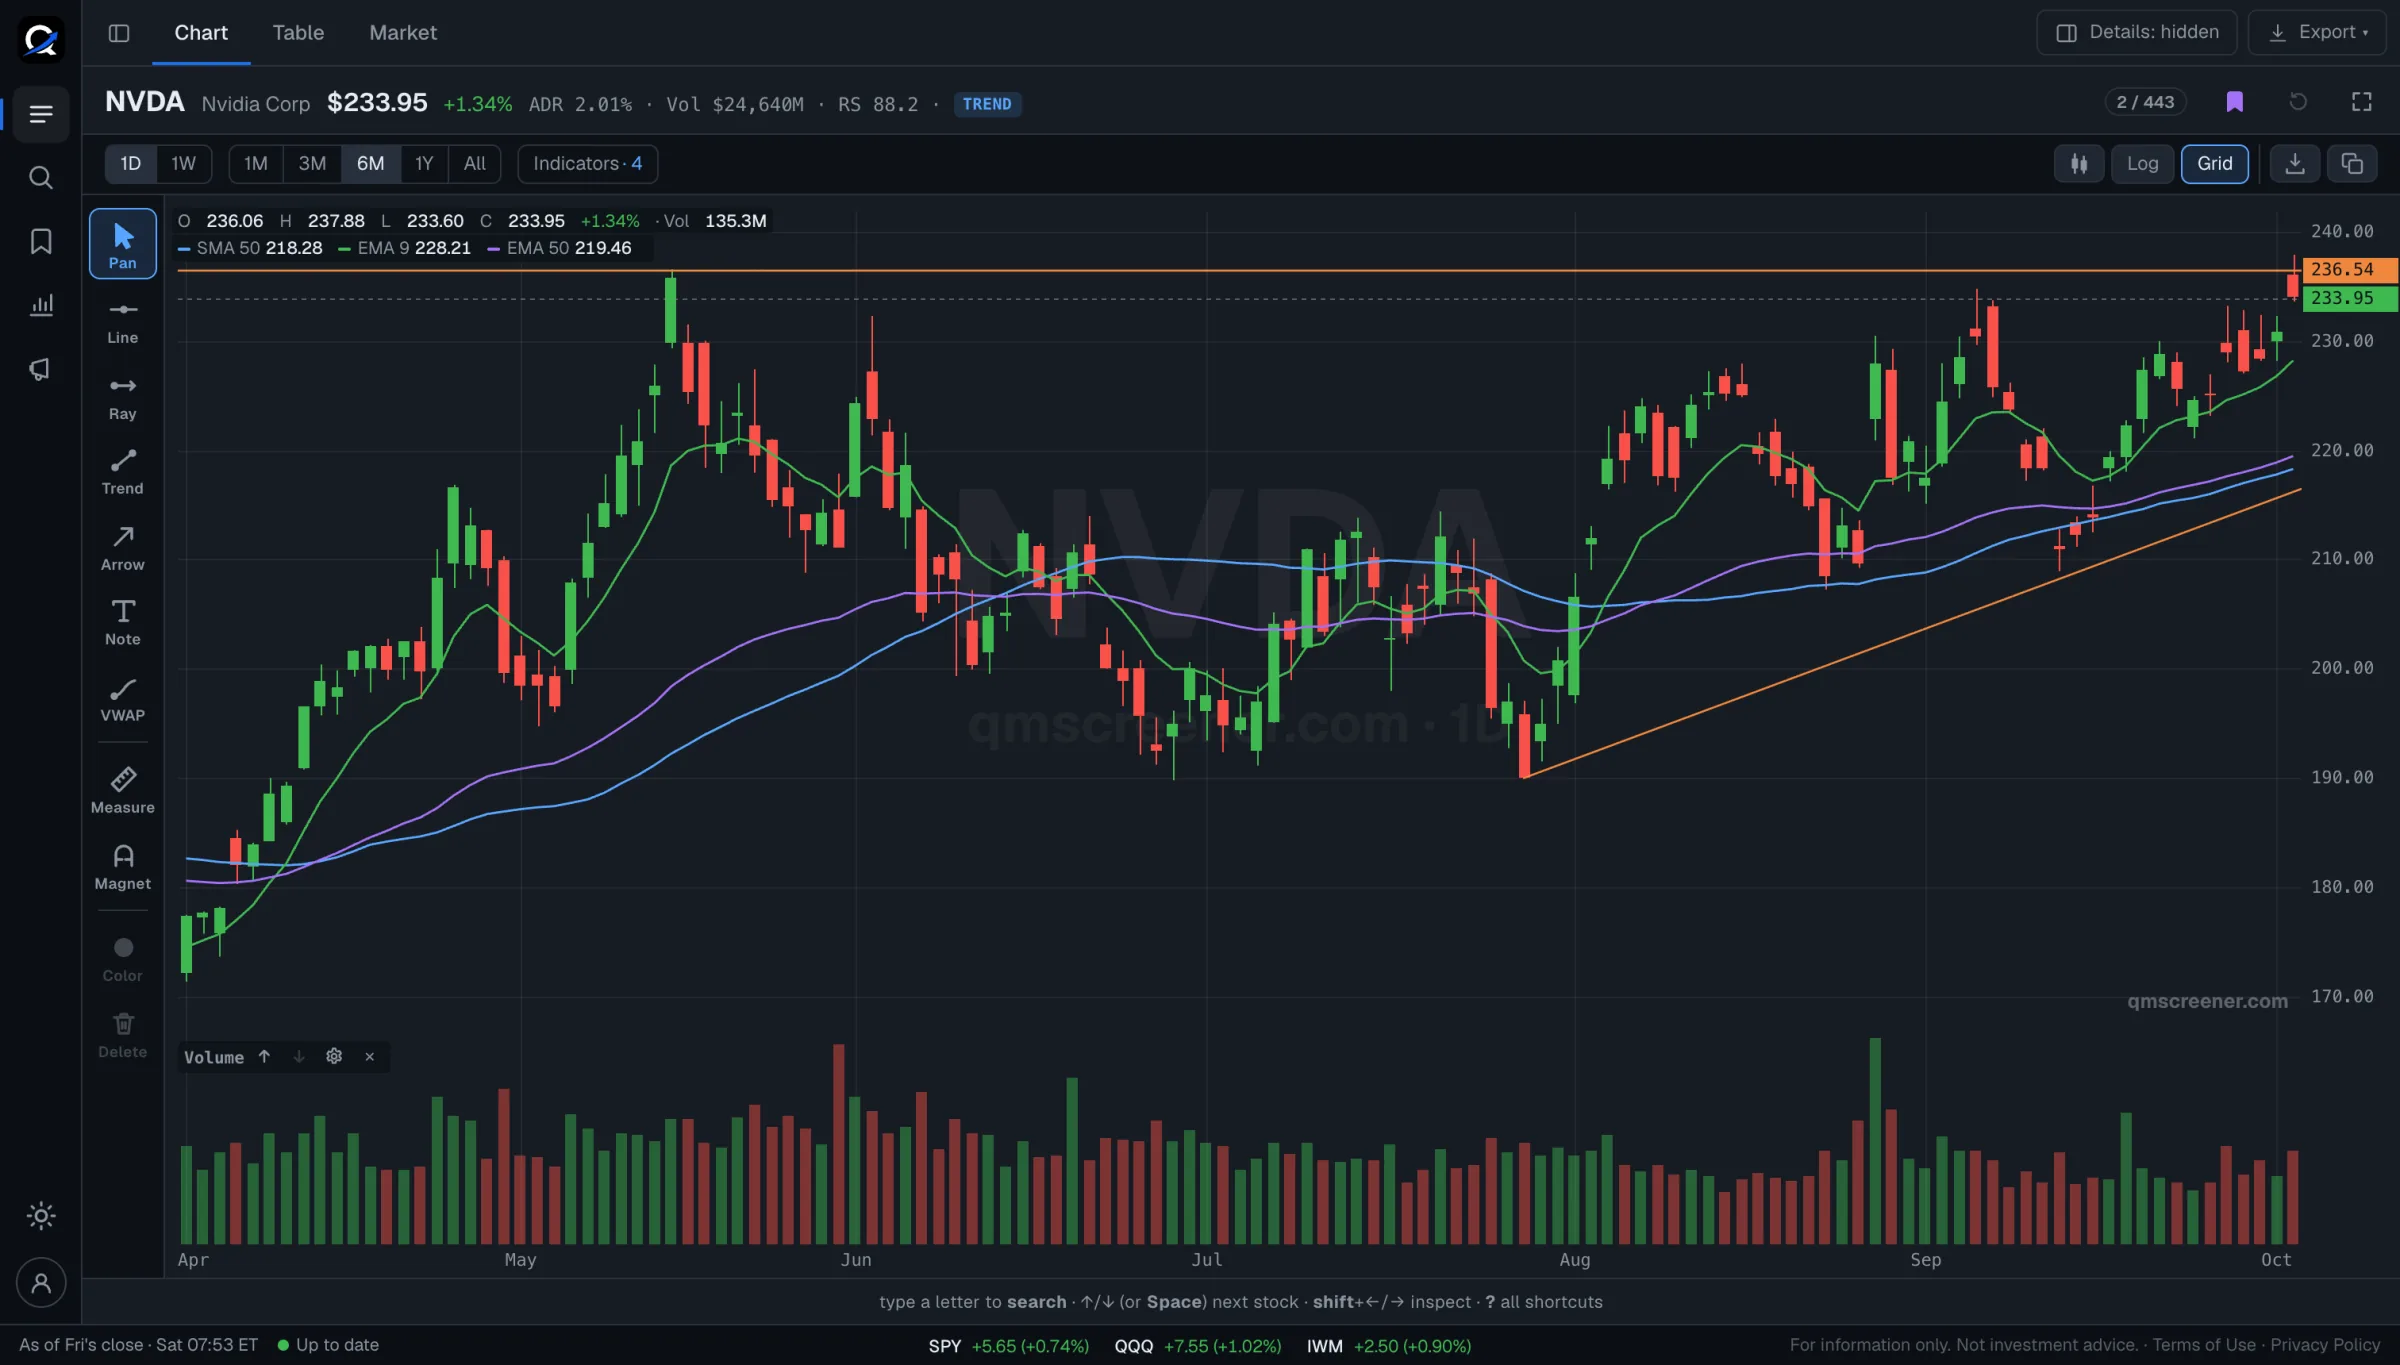
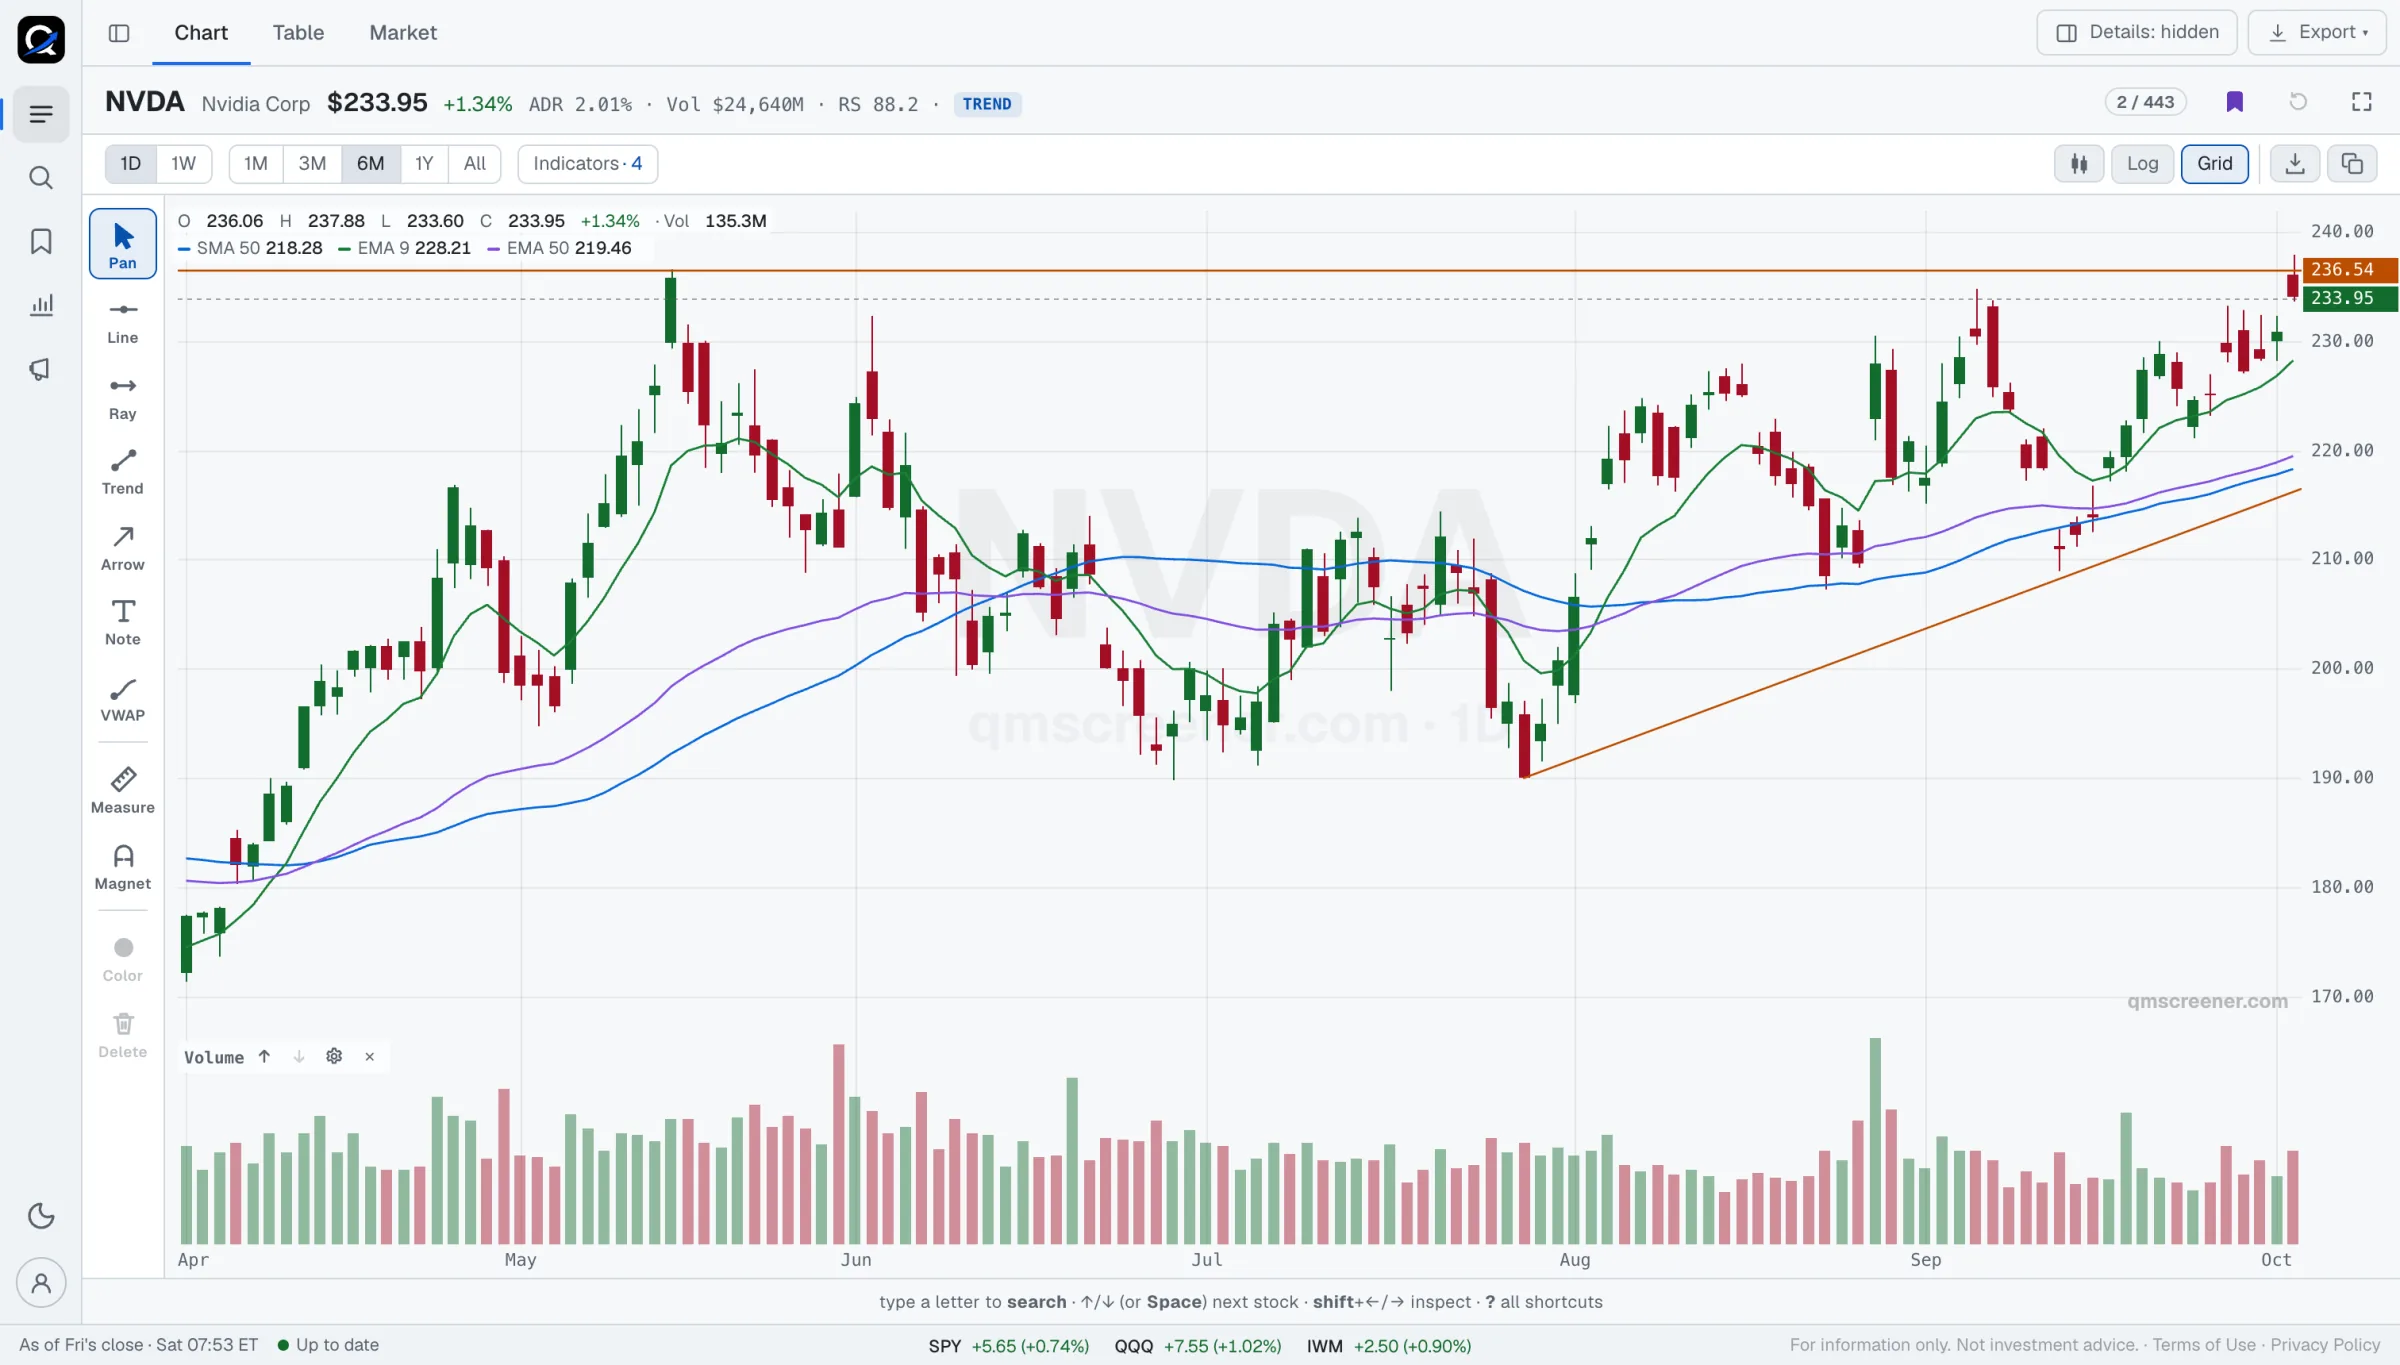
In the example, the candles show six months of daily swings. The moving averages show the trend under them, and the volume bars below show how much traded each session. Switching the chart to weekly redraws the same history as one candle per week.
What a screen can and cannot determine
A screen measures and ranks. It can say which stocks cleared a set of rules at the last close, by how much, and where each sits in the ranking. Every number it reports can be checked against the bars it was computed from.
A screen cannot say when to trade. It does not size a position, set a stop or know your account. It does not predict where a price goes next. It cannot see an earnings date, a news event or the reason a stock moved. Each row on QM Screener carries a setup tag that describes where price sits against its moving averages, and the setup tags guide gives each tag's rule. A tag does not mean the stock is a buy.
Try the screens with a free account
A free account shows the top 5 names on each screen every trading day, with their daily and weekly charts. It needs a verified email address and no card. The free stock screener page lists what it includes and what a paid plan adds.
Frequently asked questions
What is swing trading?
Swing trading is a style of trading that holds a position for a few days to a few weeks. It aims to capture one move in a stock's price. Decisions are usually made from daily bars, not intraday ones.
How long is a swing trade held?
Usually from a couple of days to several weeks. There is no fixed rule. The horizon is longer than one session, which separates it from day trading, and shorter than the months a position trade is held.
Is swing trading the same as day trading?
No. A day trader opens and closes positions within one session and works from intraday data. A swing trader holds positions overnight, often for days or weeks, and works mainly from daily and weekly charts.
What do swing traders look at on a chart?
Commonly the trend against moving averages such as the 20-day and 50-day, recent highs and lows, the size of each day's range and the volume. A weekly chart shows the larger trend, and a daily chart shows the recent swings inside it.
Do I need real-time data for swing trading?
Not for a routine that runs after the close. End-of-day bars carry every session's open, high, low, close and volume. QM Screener uses end-of-day bars only and refreshes its screens once per US trading day, after the close.
Read next
- Swing trading strategies compares four screening approaches: what each measures and which screen applies it.
- How to screen for momentum stocks covers the criteria, the default thresholds and a daily routine.
- ADR% and the volatility floor explains the range measurement in detail.
- The setup tags, one by one explains what each of the five tags is computed from.
- Free stock screener describes the free account.
Educational content, not financial advice. QM Screener lists stocks that passed published filters. It does not recommend trades, size positions or know anything about your circumstances. US equities, end-of-day, refreshed once per trading day after the close.