
What a free account includes
A verified email address, no card, and no expiry:
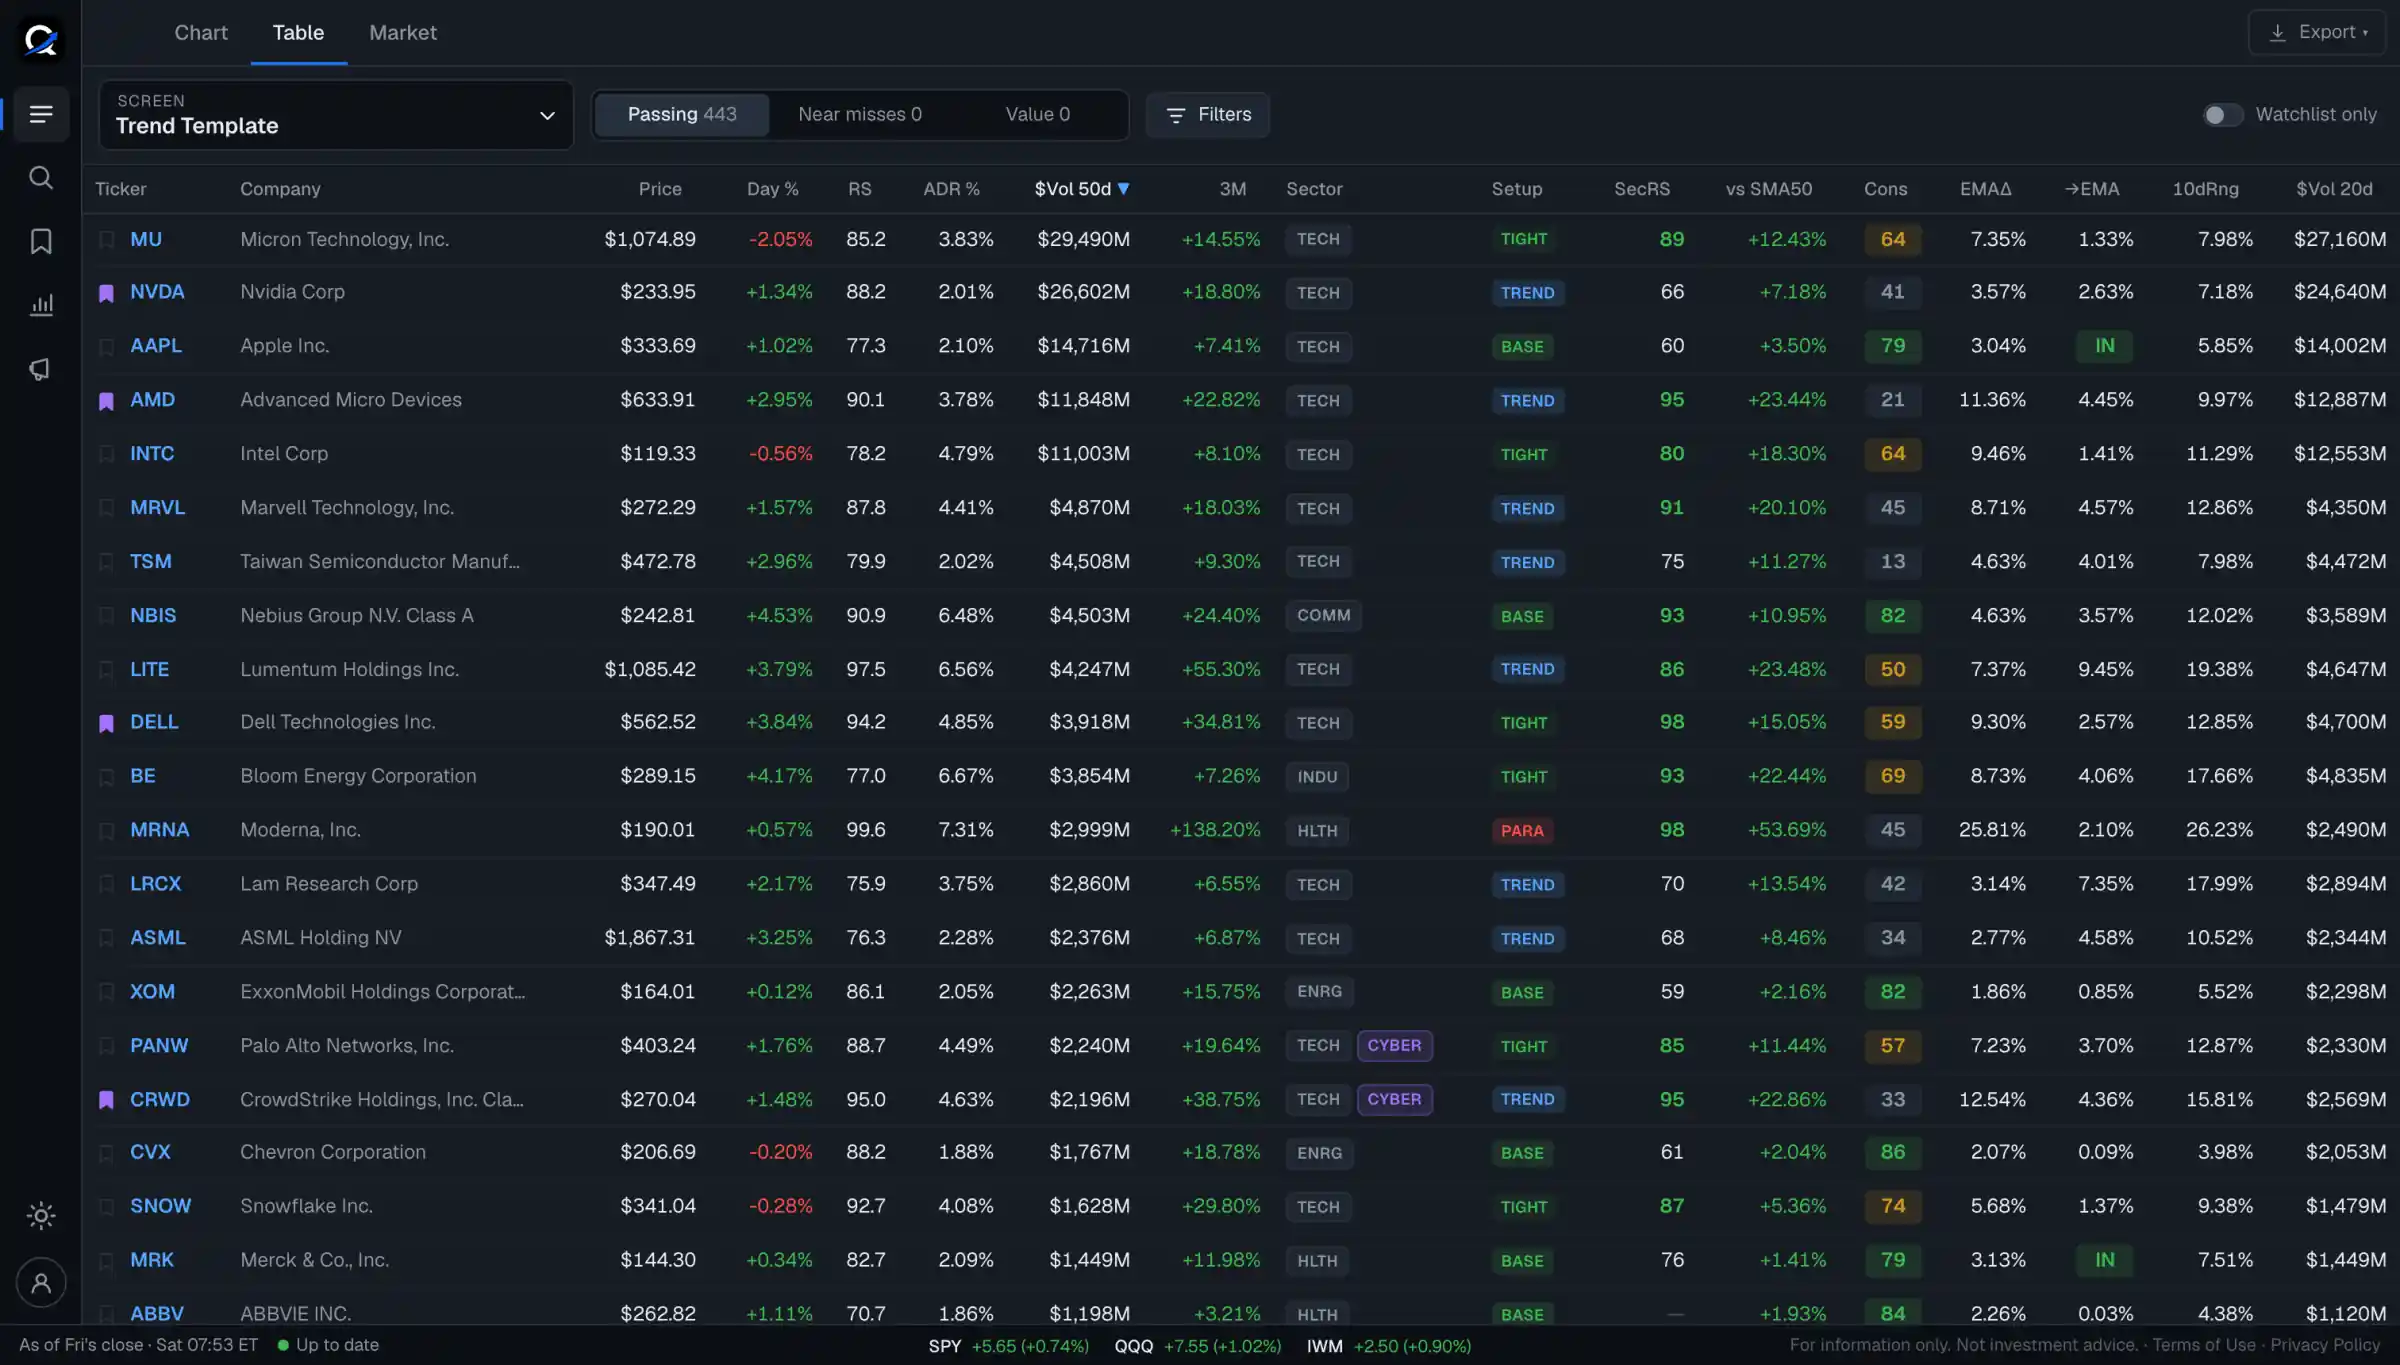
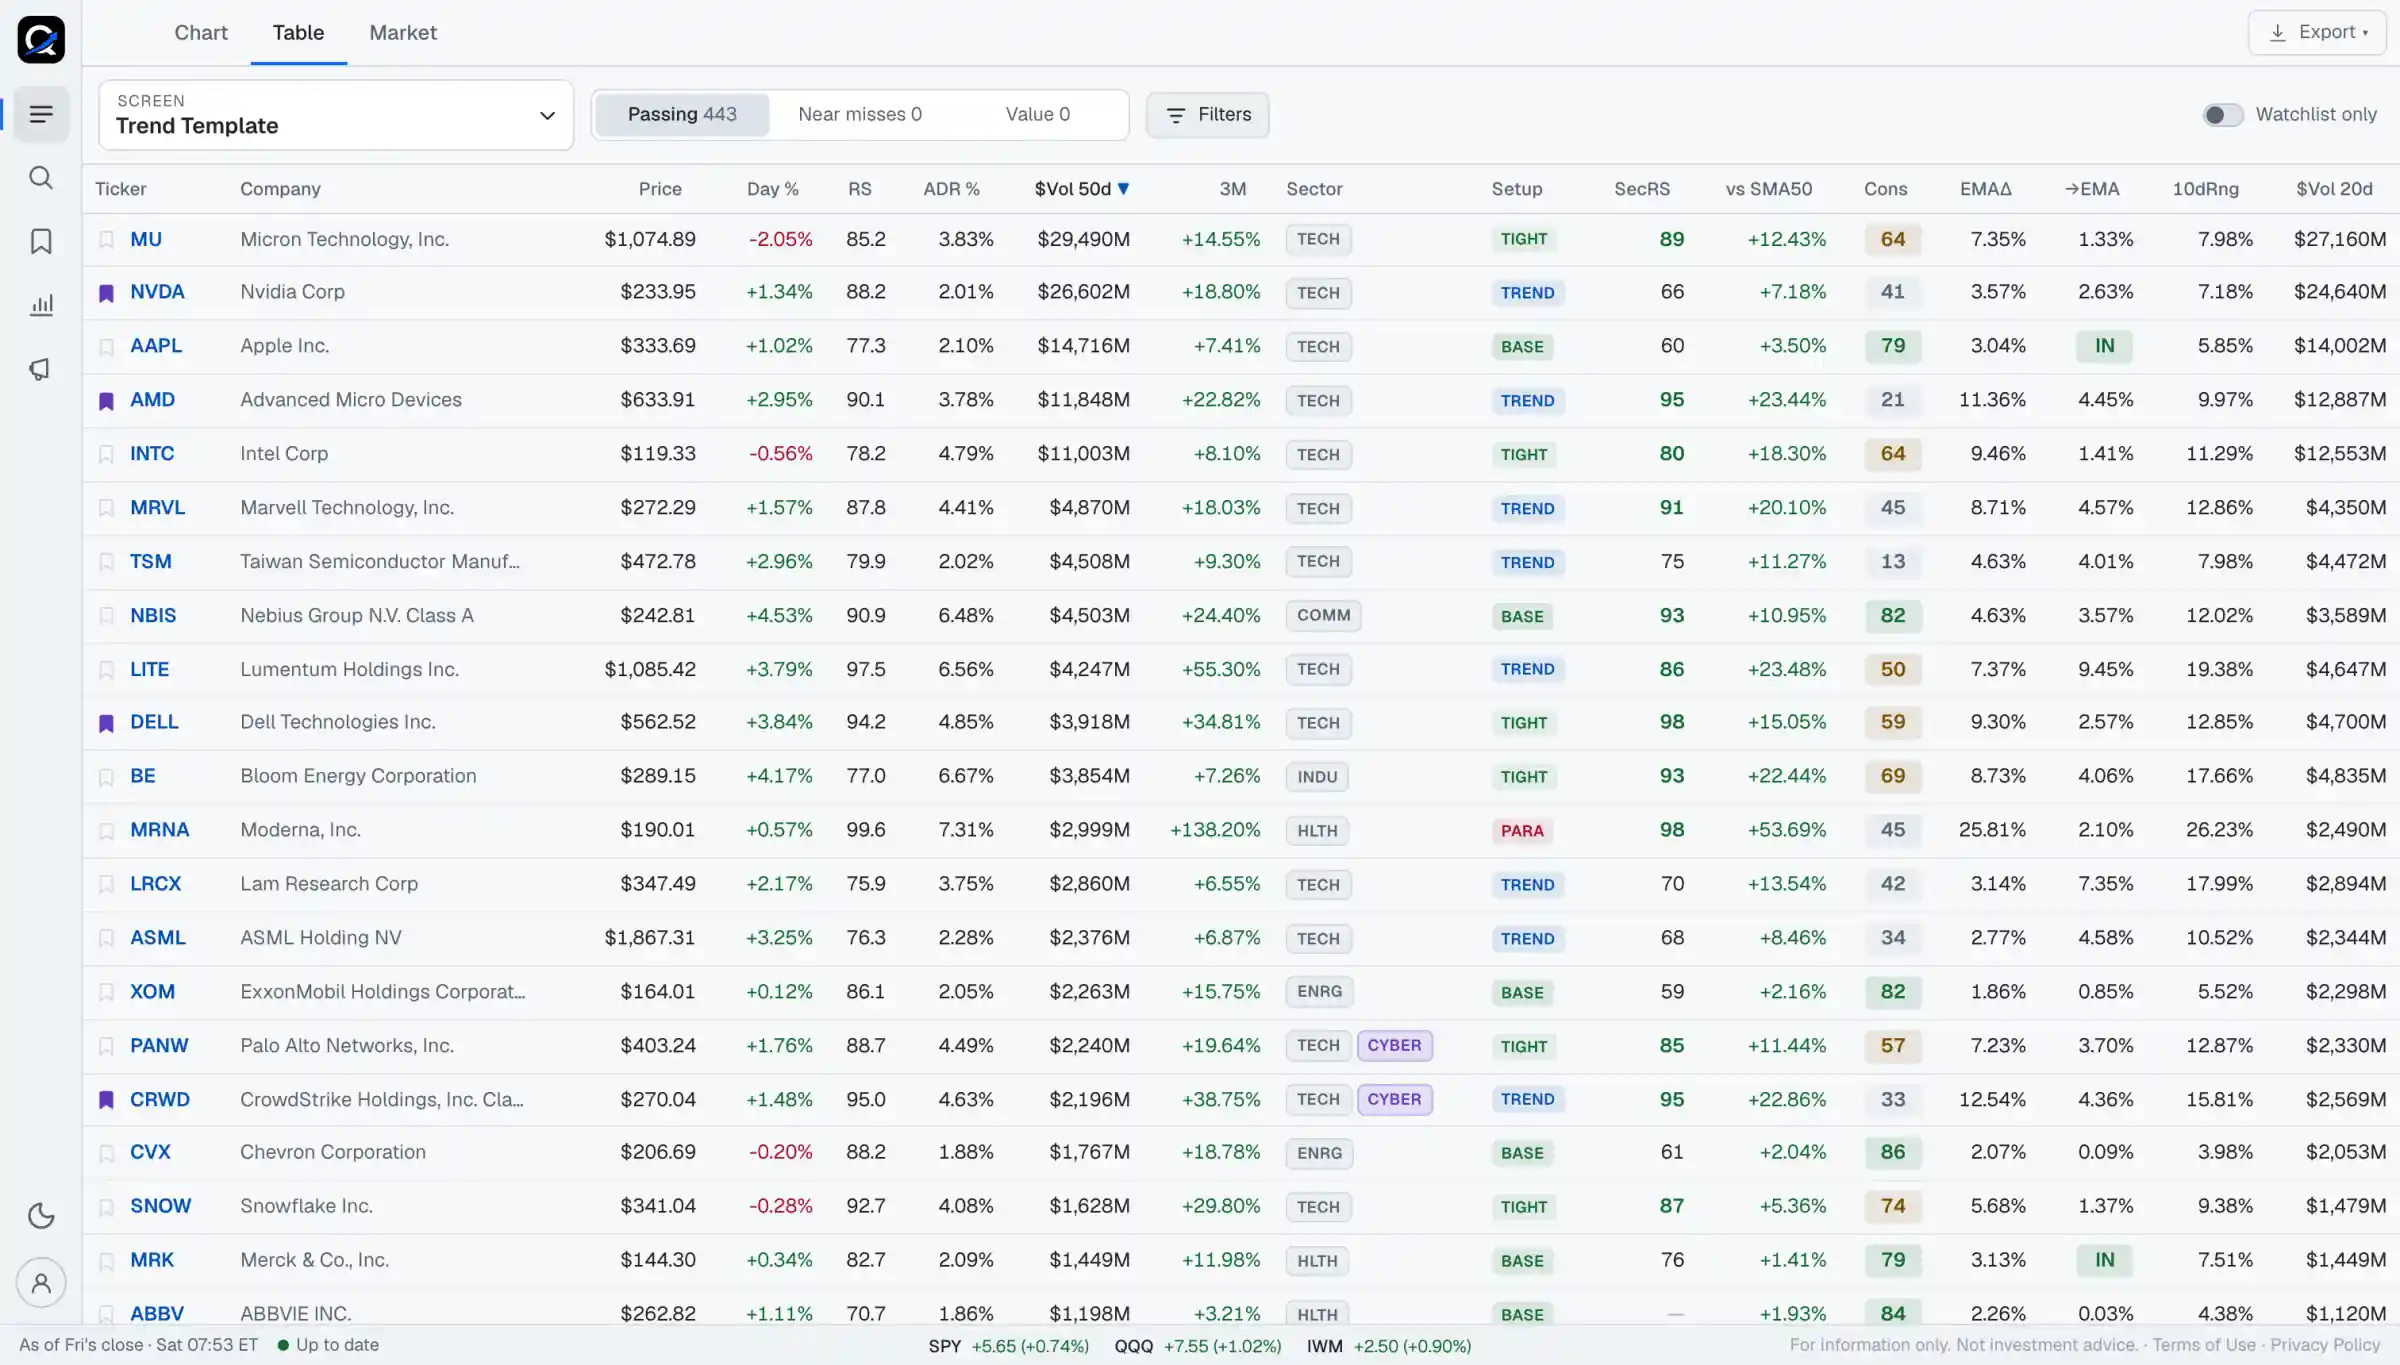
- The dashboard a subscriber sees, carrying the top 5 names of each of the seven screens, ranked by that screen's own sort.
- Price charts for those names, and Multiple Charts with them: your list and the strength tape's funds chart in full, a name outside the free preview shows an upgrade prompt in place of its chart, and the sector, industry and theme presets are left out.
- Setup tags, the sector strength strip and the market breadth history.
- The market heat map, carrying the names of that free preview.
- Filters on the columns those rows carry, and the PNG and share-text exports of those names.
A setup tag is the label each row carries (BASE, TIGHT, TREND, EXT, PARA): one word for where price sits against its moving averages. The setup tags guide gives each tag's rule. The sector strength strip, also called the strength tape, ranks 30 sector, industry and theme funds against SPY.
How the screens work
There are seven screens, six published methods and one pullback cut: Momentum Pullback, which narrows the Momentum Continuation list. They are Momentum Continuation, Trend Template, VCP, Gappers, Defensive Strength, Swing Momentum and Momentum Pullback. Each one runs over the full US stock market after every US close, on end-of-day bars. Every row carries its relative strength (RS): a stock's three-month return, ranked as a percentile against every other screened stock. The momentum screening guide covers the criteria and their default thresholds, and the other guides go deeper on single screens, the setup tags and market breadth. What is swing trading? explains the after-the-close research routine the screens are built for.
What the dashboard looks like
Free versus paid
| Free account | Paid plan | |
|---|---|---|
| List depth | The top 5 names of each screen, ranked by that screen's own sort | Every passing name, plus the near-miss and value lists |
| Charts | Daily and weekly charts for those names and for the strength tape's funds | Charts for every result and any other symbol, with symbol search |
| Multiple Charts | Your list, the strength tape's funds and your saved groups | Also the sector, industry and theme presets, paged through the whole list |
| Market heat map | The names of your free preview | Every stock the screener sorts into a sector |
| Exports | PNG and share text of the names shown | PNG, share text, a TradingView watchlist and CSV |
| Watchlist | Not included | A watchlist of your own |
| Optional: the free daily email, which anyone can join without an account, with the top 5 names on each screen after the close | The optional daily email digest | |
| API and MCP tools | The public tools, which need no account: the screen list, the top setups, sector strength and market breadth | Also the subscriber tools: each screen's full results and the price history behind any name |
| Price | Free. No card, no expiry | $10 a month or $84 a year ($7 a month), after a 7-day free trial |
The free account needs no card. The trial asks for one and charges nothing until it ends.
Free stock screener FAQ
Is the free stock screener really free?
Yes. A free account needs a verified email address and nothing else: no card and no time limit. It shows the top 5 names on each of the seven screens every trading day, with their charts.
Do I need a credit card?
No. The free account never asks for one. A card is asked for only if you start the 7-day trial of a paid plan, and it is not charged until the trial ends.
Which markets does it cover?
US-listed stocks only. Each screen runs over the full US stock market. There are no options, futures, crypto or fundamentals.
When does it refresh?
Once per US trading day, after the close. Each list records the session it screened, so it says which close it describes.
Can I see charts with a free account?
Yes: daily and weekly charts for the names your account shows, drawn from the same end-of-day bars the screens used. The preview on the home page, which needs no account, shows a picture of each name's daily chart.
What does a paid plan add?
Every passing name on every screen, the near-miss and value lists, charts for any symbol with symbol search, the watchlist, the TradingView and CSV exports, the daily email digest and the subscriber API and MCP tools. It is $10 a month or $84 a year ($7 a month), after a 7-day free trial.
Is the data real-time?
No. Everything is end-of-day: the screens run once after each US close on daily bars, and there is no intraday data.