
Momentum Continuation
Liquid US stocks in the top 7% of relative strength (above the 93rd percentile), trading above the 50-day moving average and moving enough each day to be worth a swing trade.
Six screens · Full US market · Refreshed after every close
For swing and position traders who build a watchlist from end-of-day data after the US close. Six screens cover the whole US market, and every name that passes opens as a chart.
$10/month after trial · no charge today · cancel anytime
Or a free account, no card: the top 5 names on each screen


Live preview · no signup needed
The top 5 names on each screen from the last completed US session, in that screen's own sort order. A free trial shows every passing name on all six.
| Ticker | Setup | Price | RS | 3M | vs 50d |
|---|---|---|---|---|---|
| XHLD | PARA | $12.95 | 100 | +689.63% | +98.88% |
| QMCO | PARA | $31.68 | 100 | +167.34% | +61.04% |
| ASST | EXT | $29.44 | 100 | +153.36% | +52.79% |
| GLND | PARA | $5.54 | 100 | +135.74% | +196.99% |
| TEAM | TREND | $187.74 | 100 | +136.87% | +21.67% |
Free · no account
The top 5 names on each screen, emailed each trading day after the US close. Confirm once from your inbox. Unsubscribe anytime.
01The list
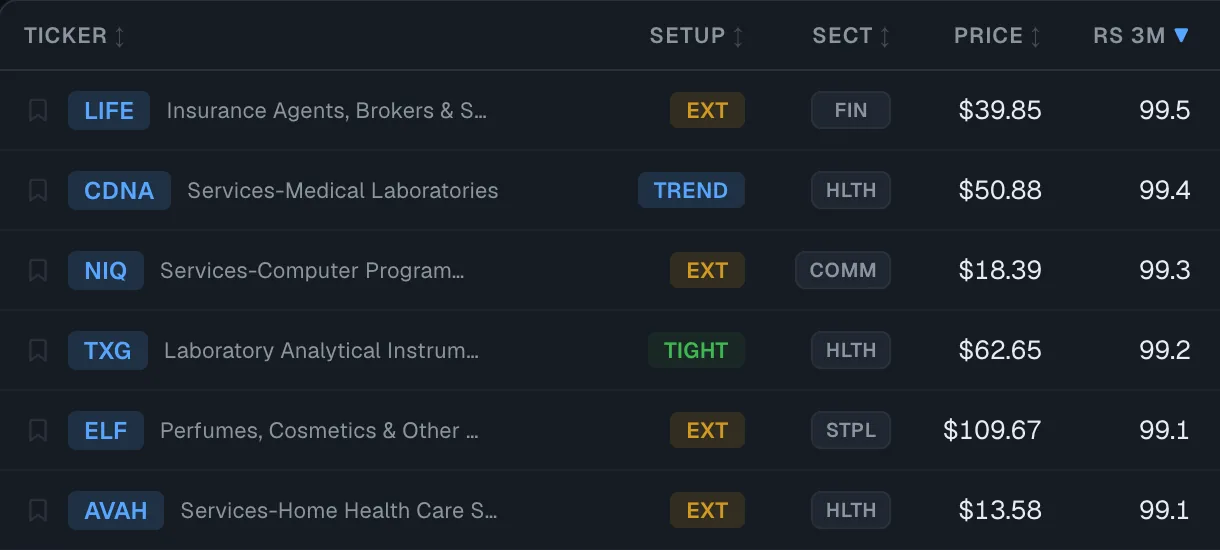
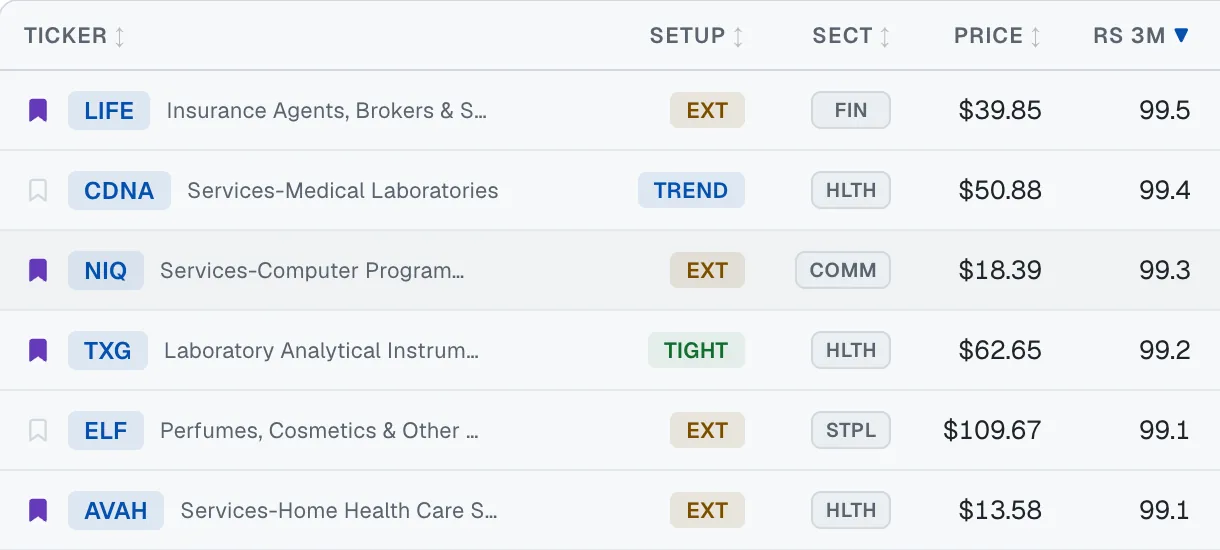
Each row shows price, relative-strength rank, average daily range, dollar volume and distance from the 50-day moving average. RS is where the stock's three-month return ranks against the rest of the US market, from 0 to 100. ADR is how far the stock moves on a typical day. A setup tag on each row says whether the stock is basing or has already run. Above the table, the sector strength strip ranks sector, industry and theme ETFs against SPY. Filter by sector, RS or setup tag, then switch to Chart view and page through the list.
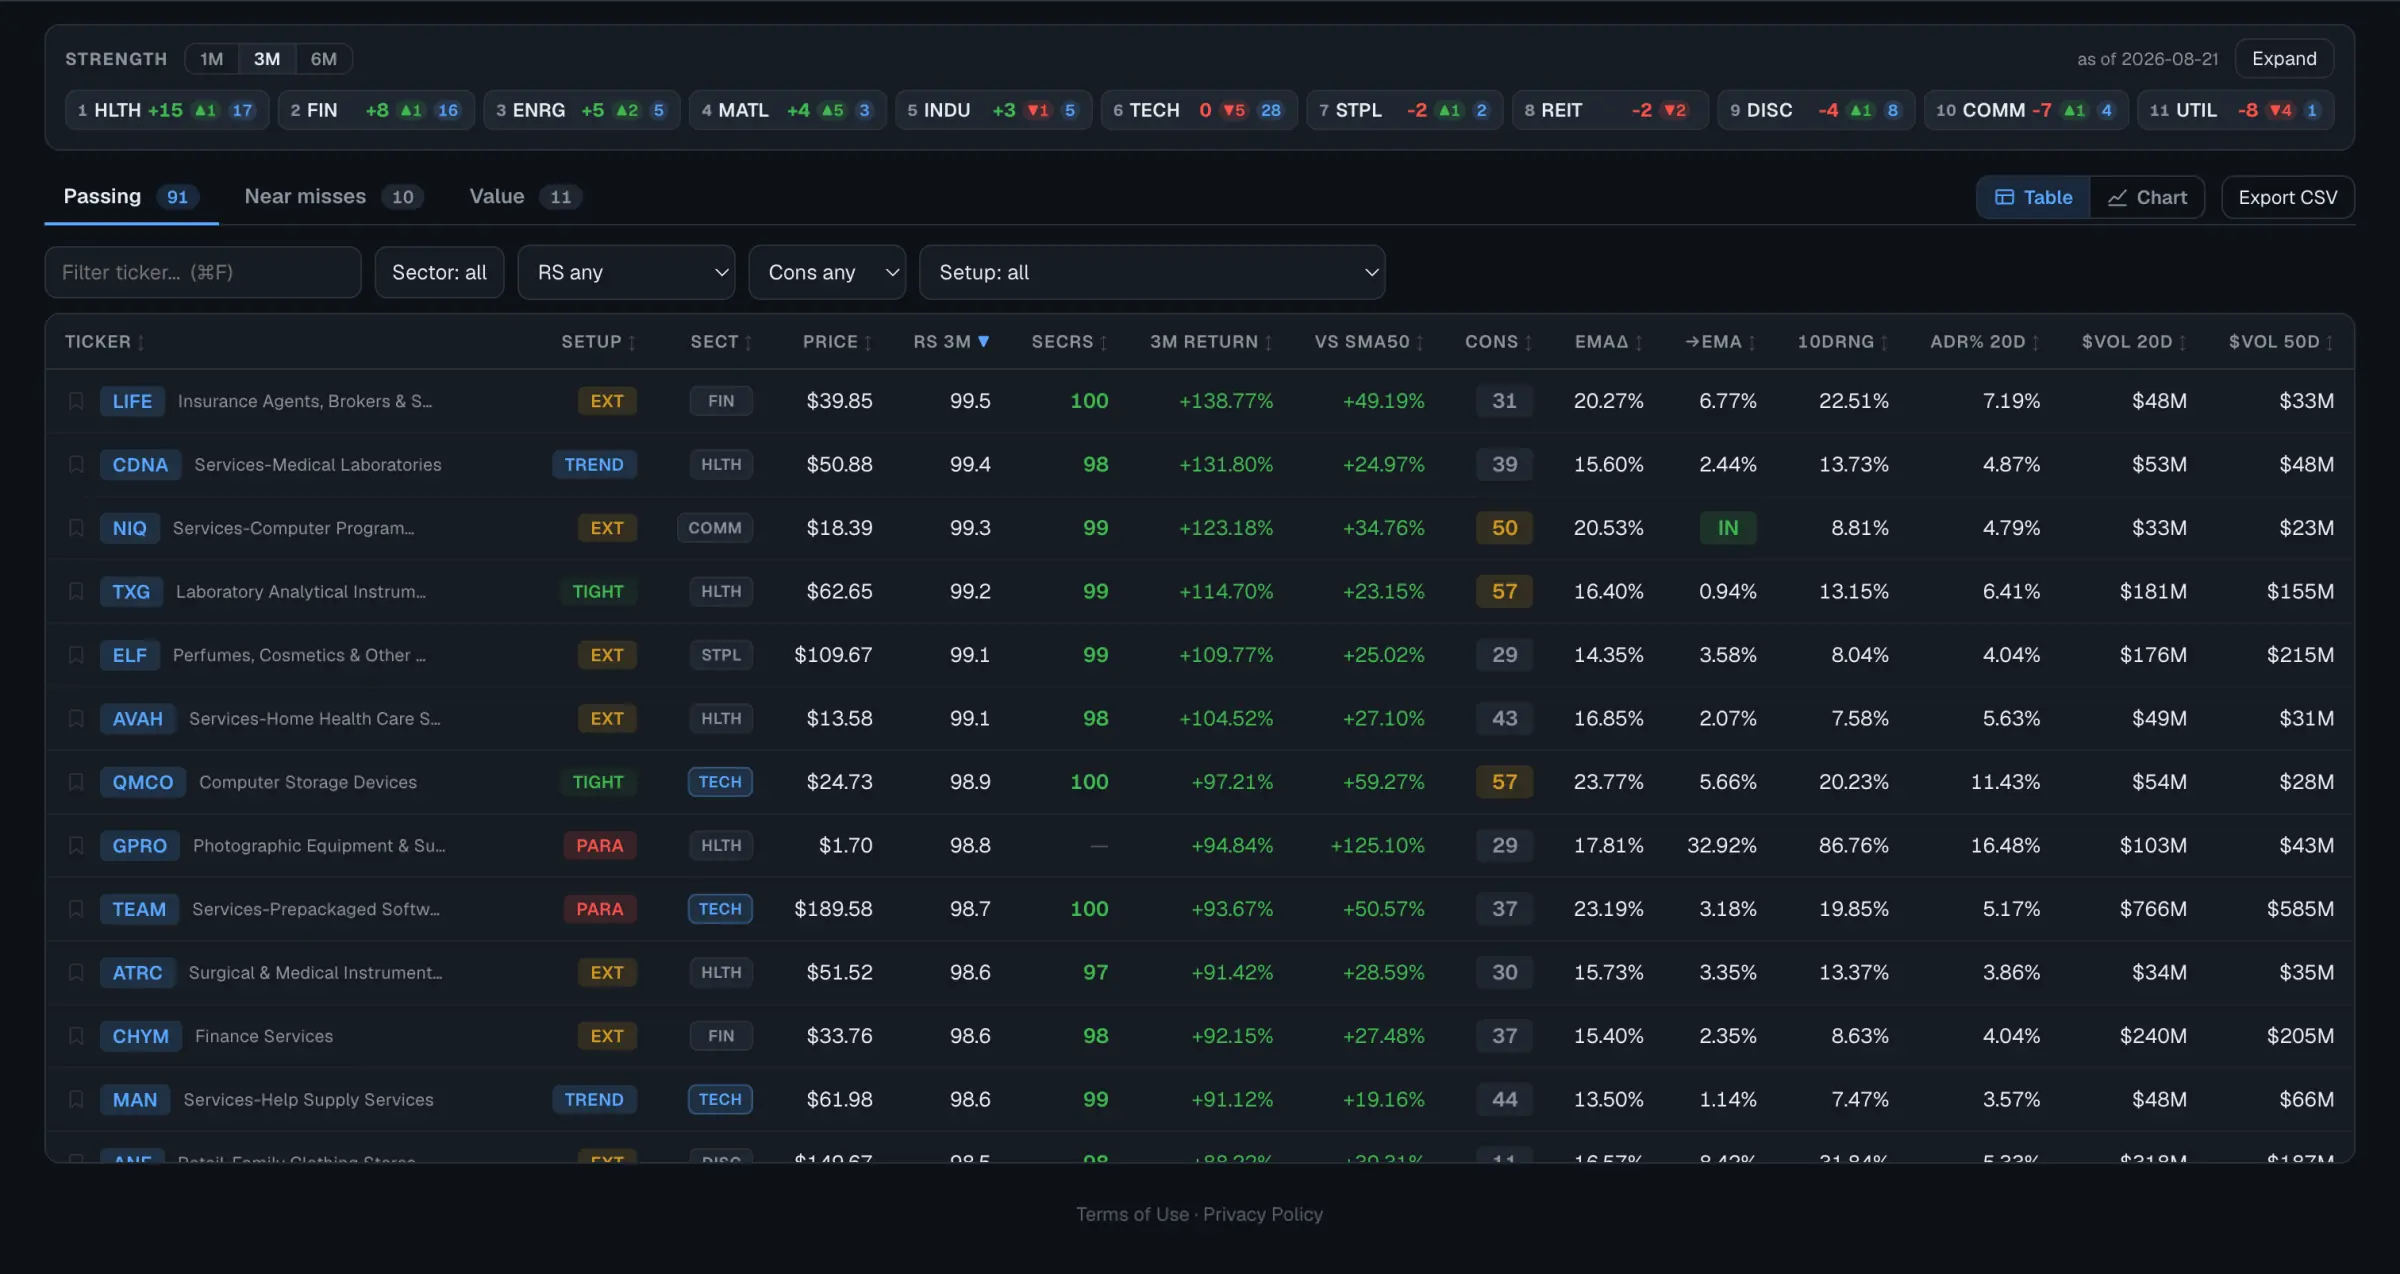
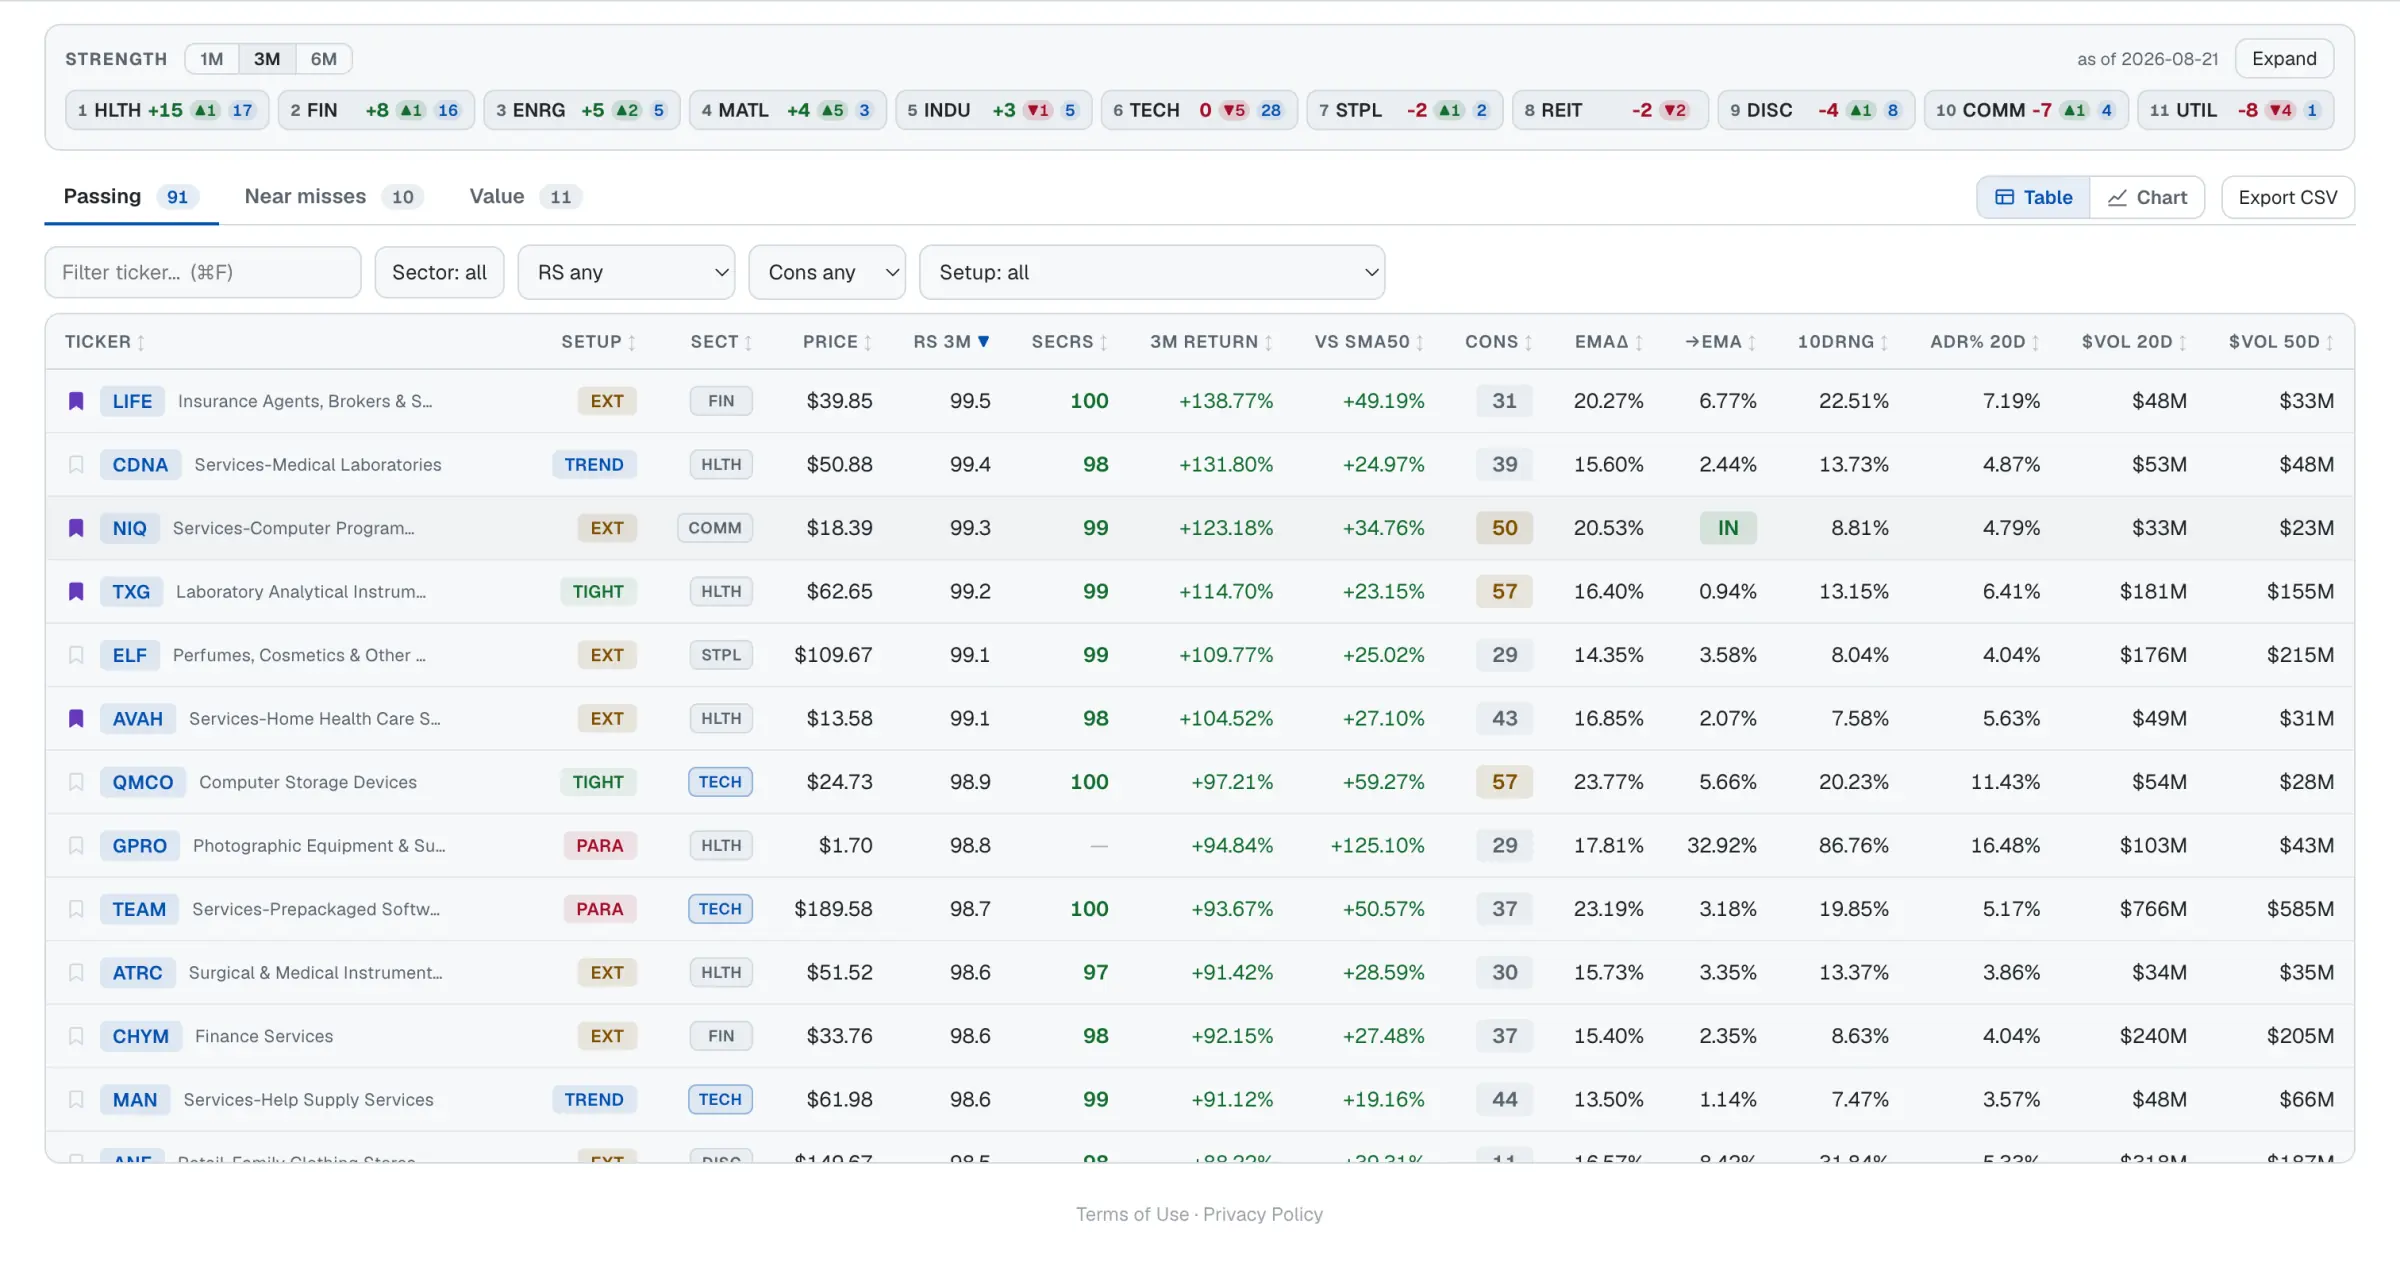
// Table view · one screen's passing list
02Charts
Daily or weekly candles, with the exponential moving averages (EMAs) you trade. Lines, rays, notes, trendlines and anchored VWAP are saved per ticker, so the chart opens the way you left it. It is drawn from the same end-of-day bars the screen used.
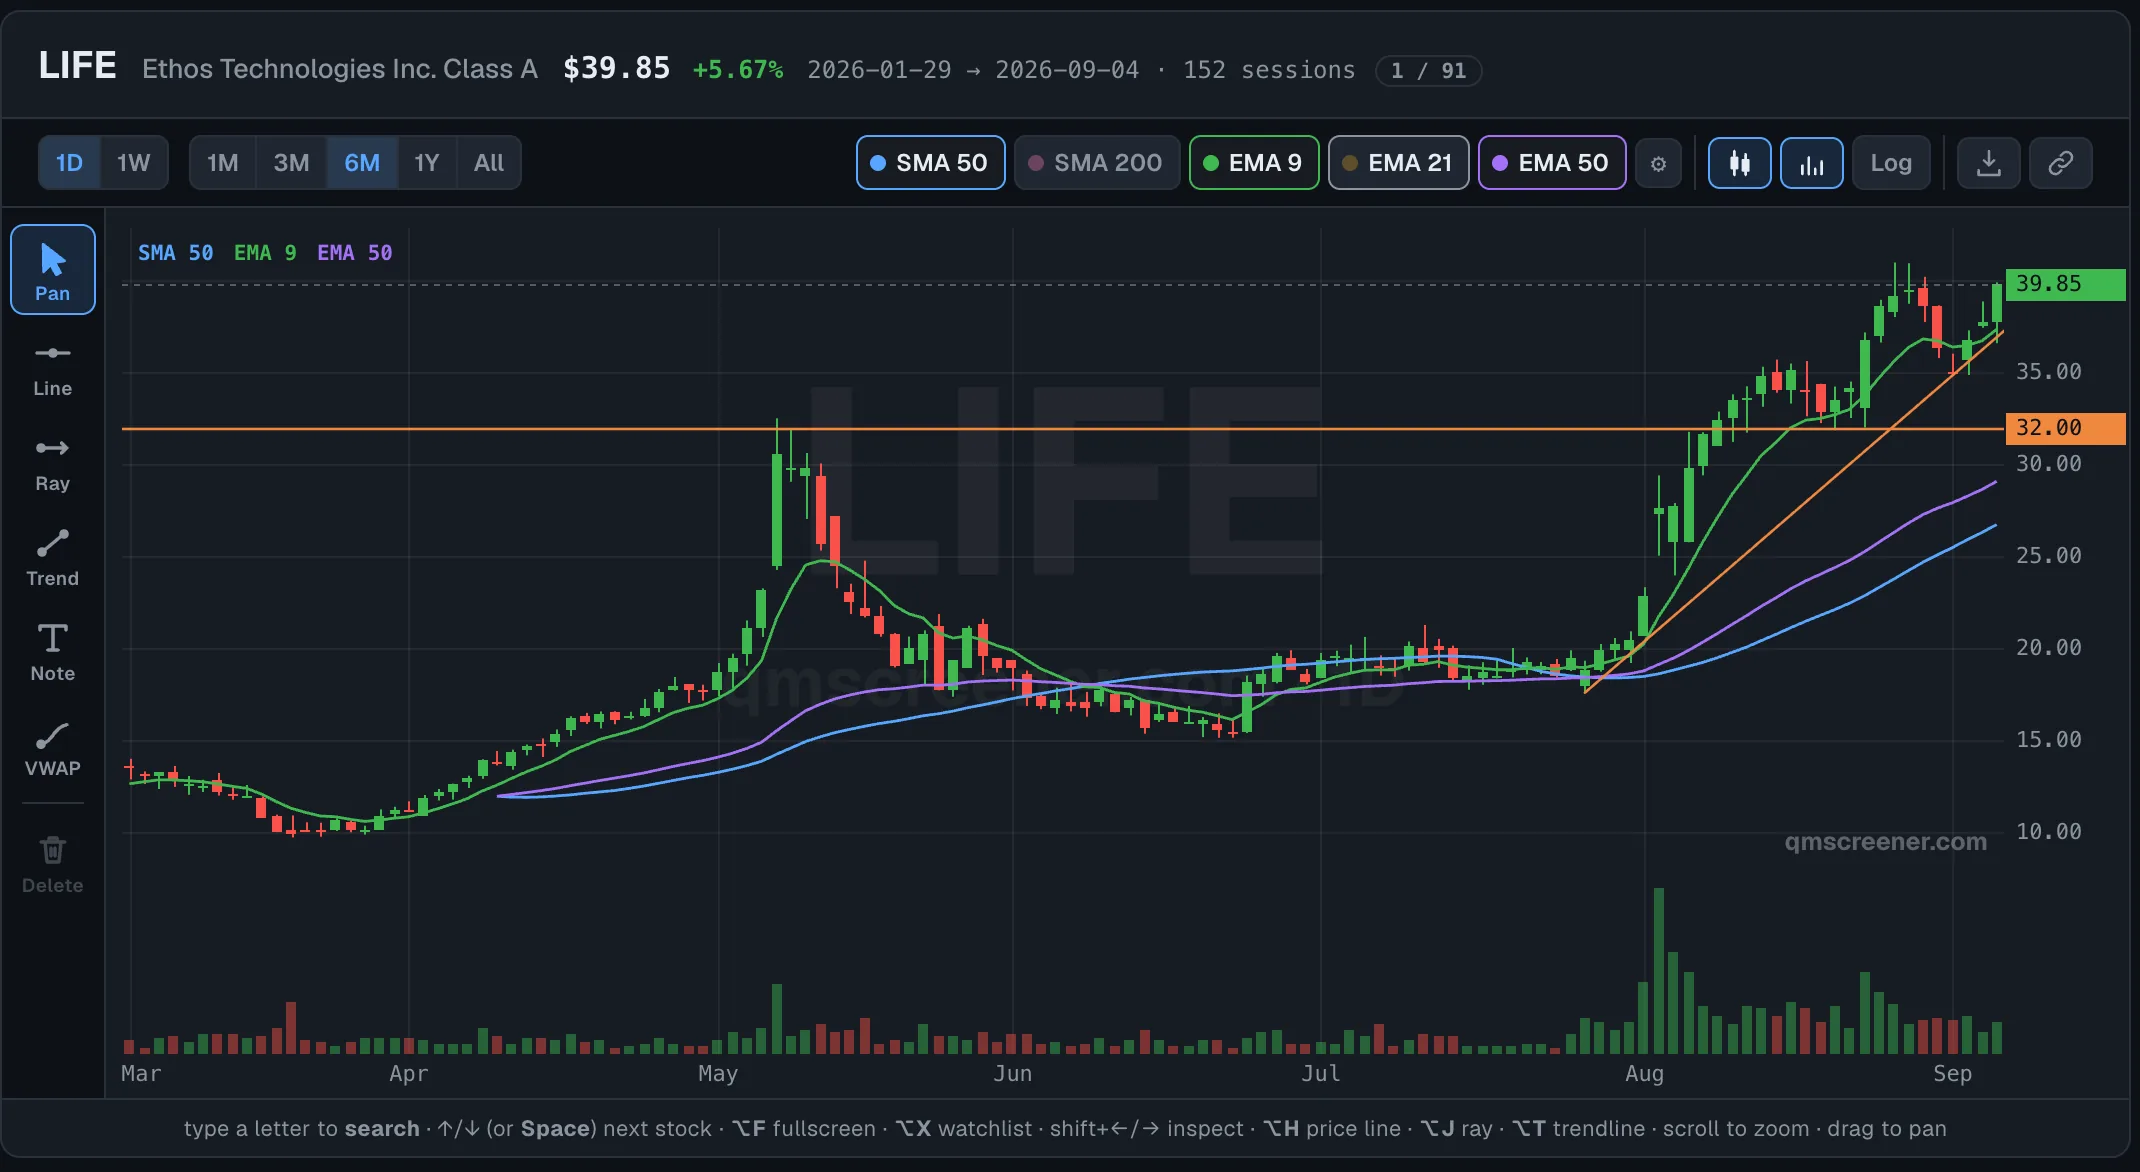
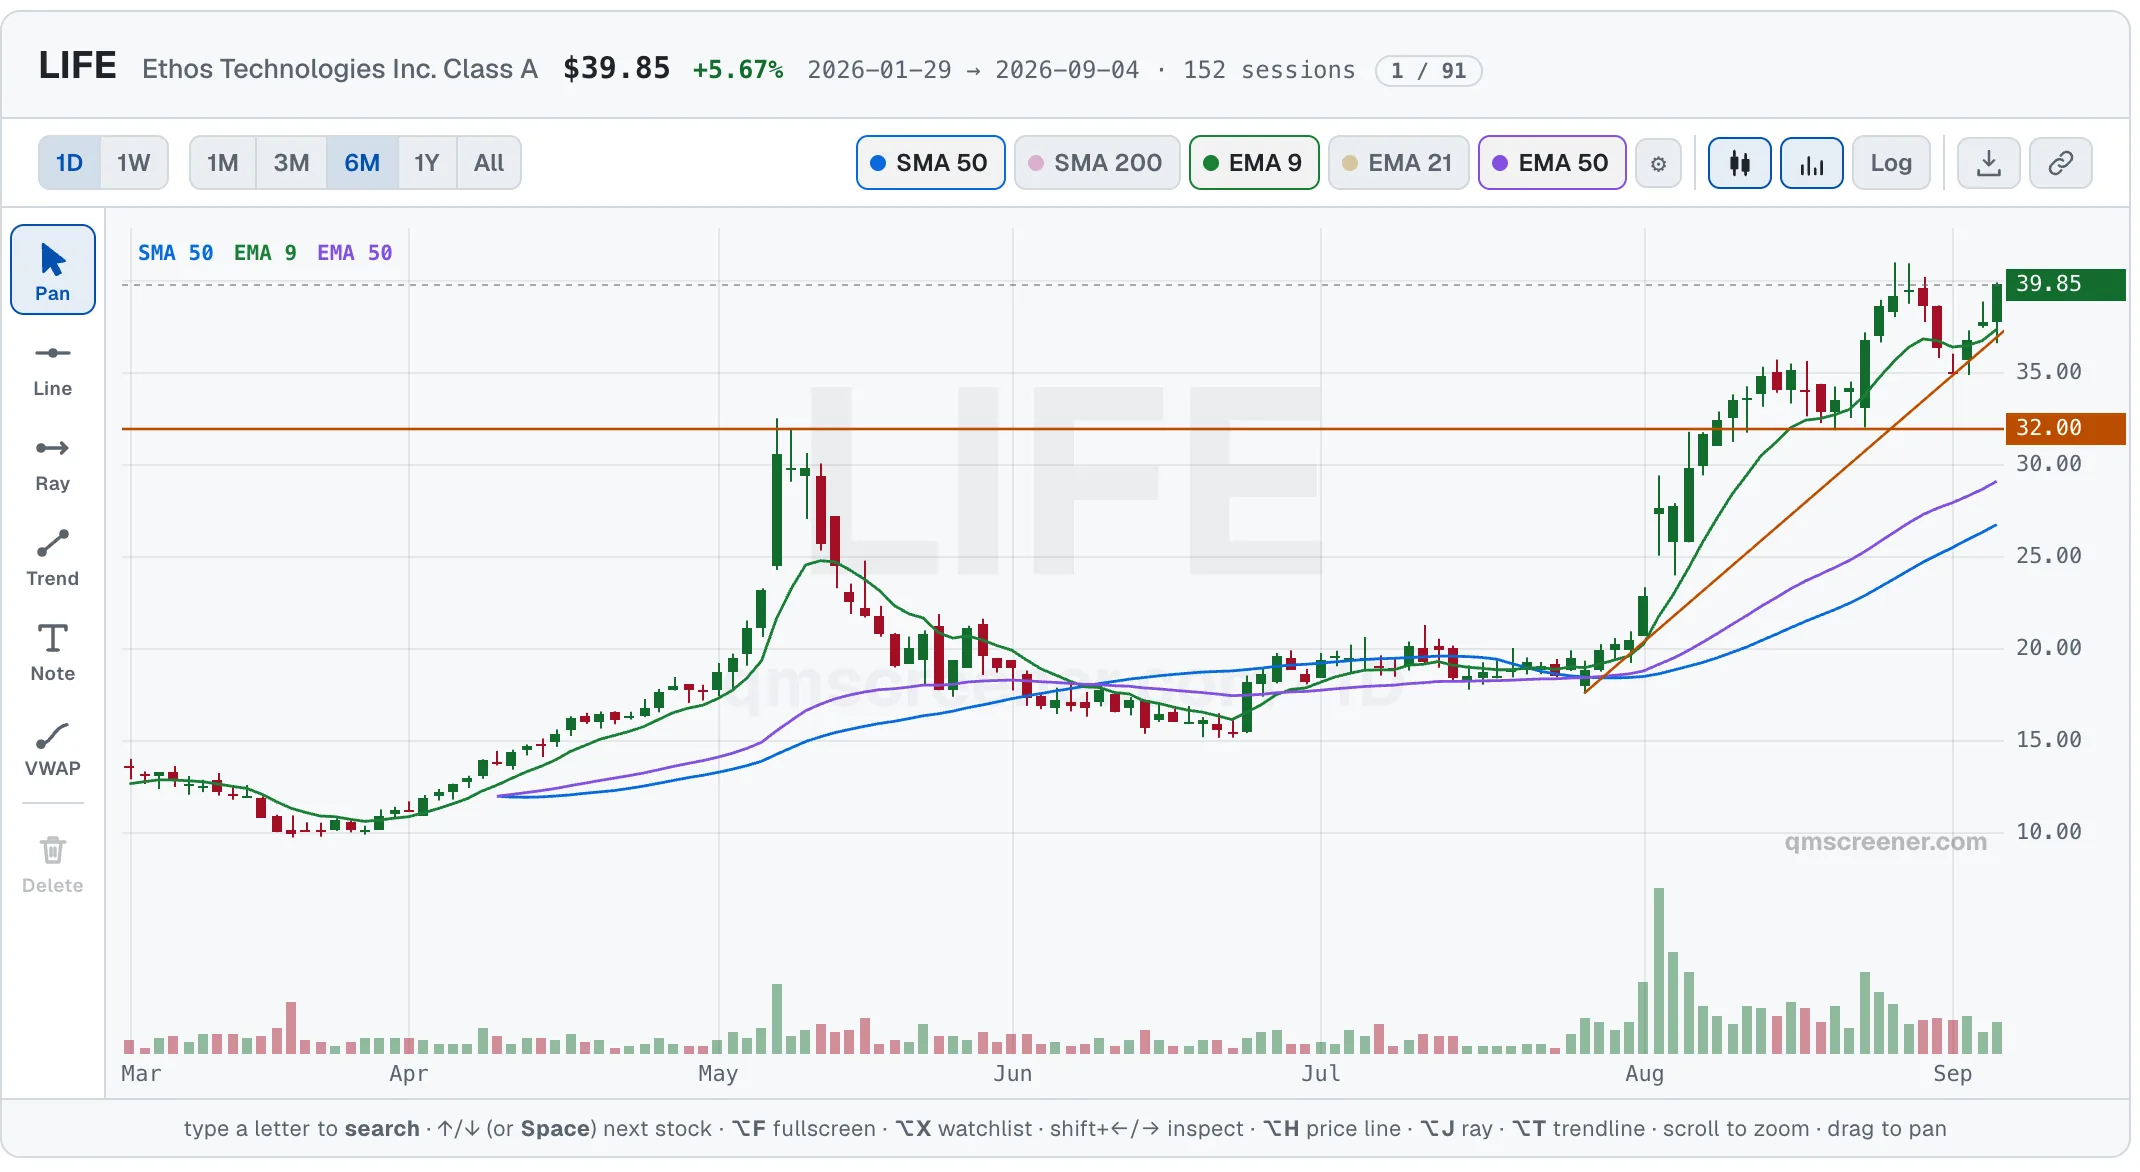
// Daily candles · EMA 9 / 21 / 50 · a ray at the level
03Setups & sectors
Every row is tagged BASE, TIGHT, TREND, EXT or PARA. The tag is scored against the stock's own average daily range, so a fast mover and a slow one are each measured by their own normal day. The sector strength strip shows which groups are leading before you open a chart.
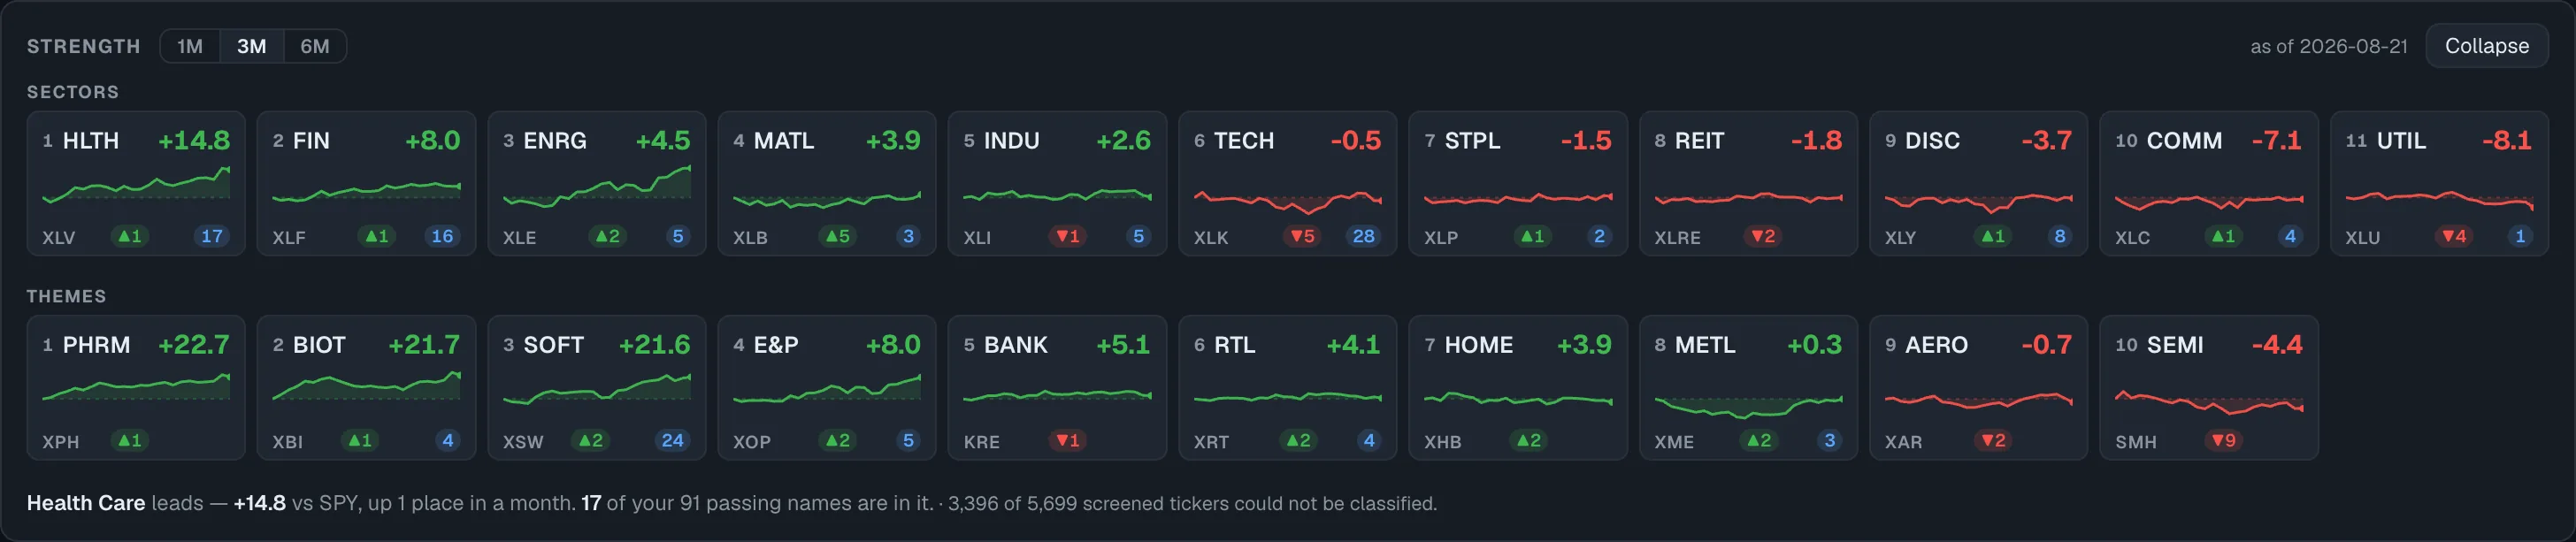
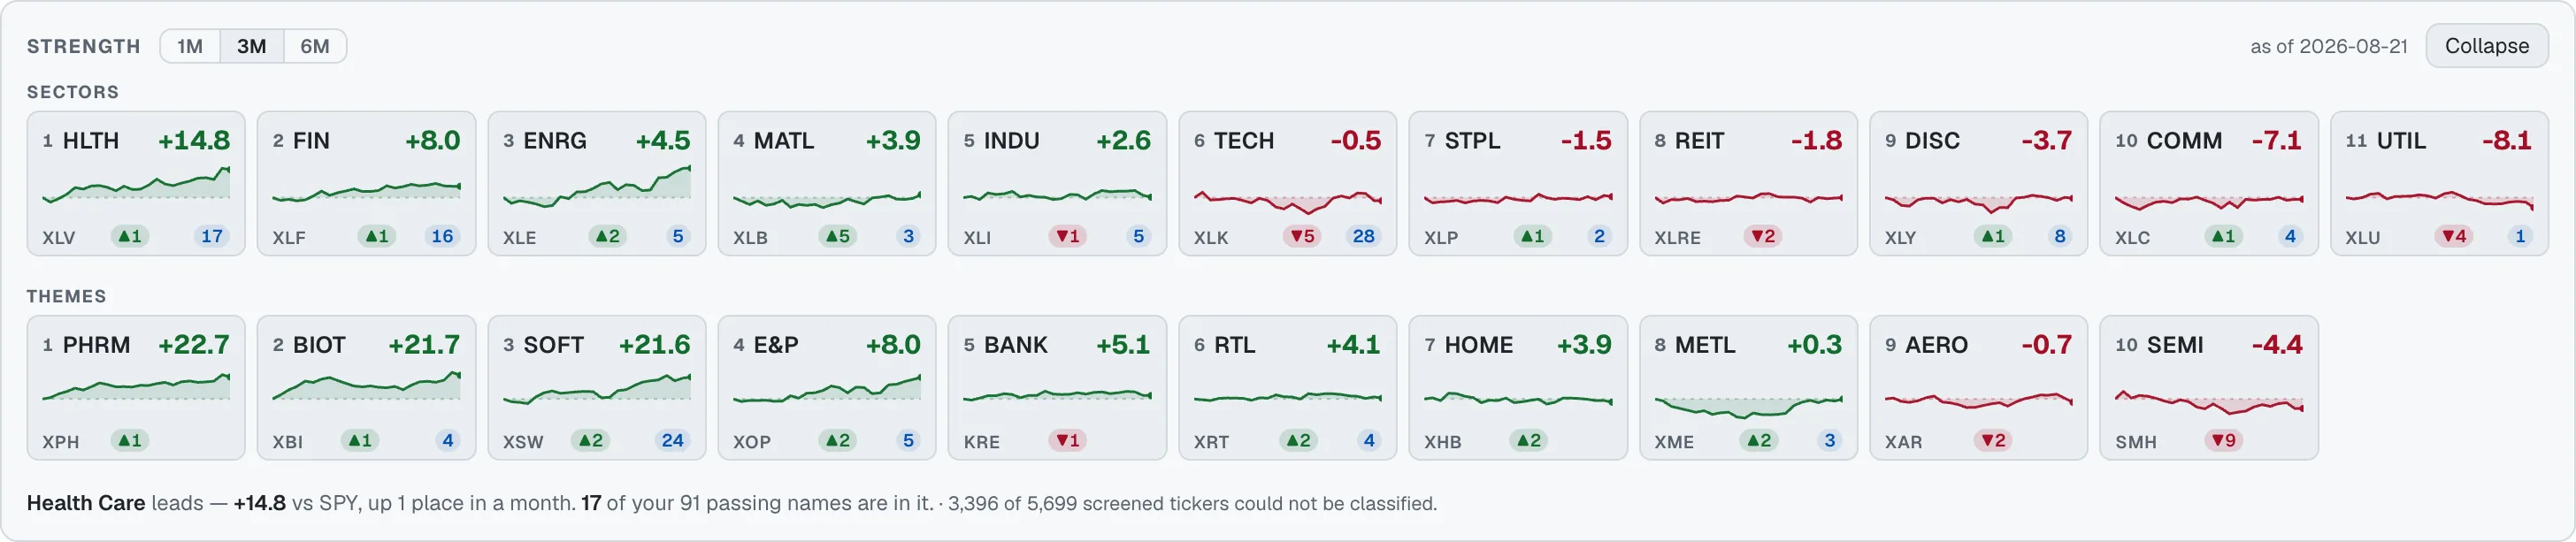
// Sector strength · 30 sector, industry and theme ETFs against SPY
04Workflow
Look up any US stock, bookmark the ones you want to see again, and export the list, filtered or whole.
Type a few letters of a ticker or company name to jump to any US stock, whether it passed a screen today or not.
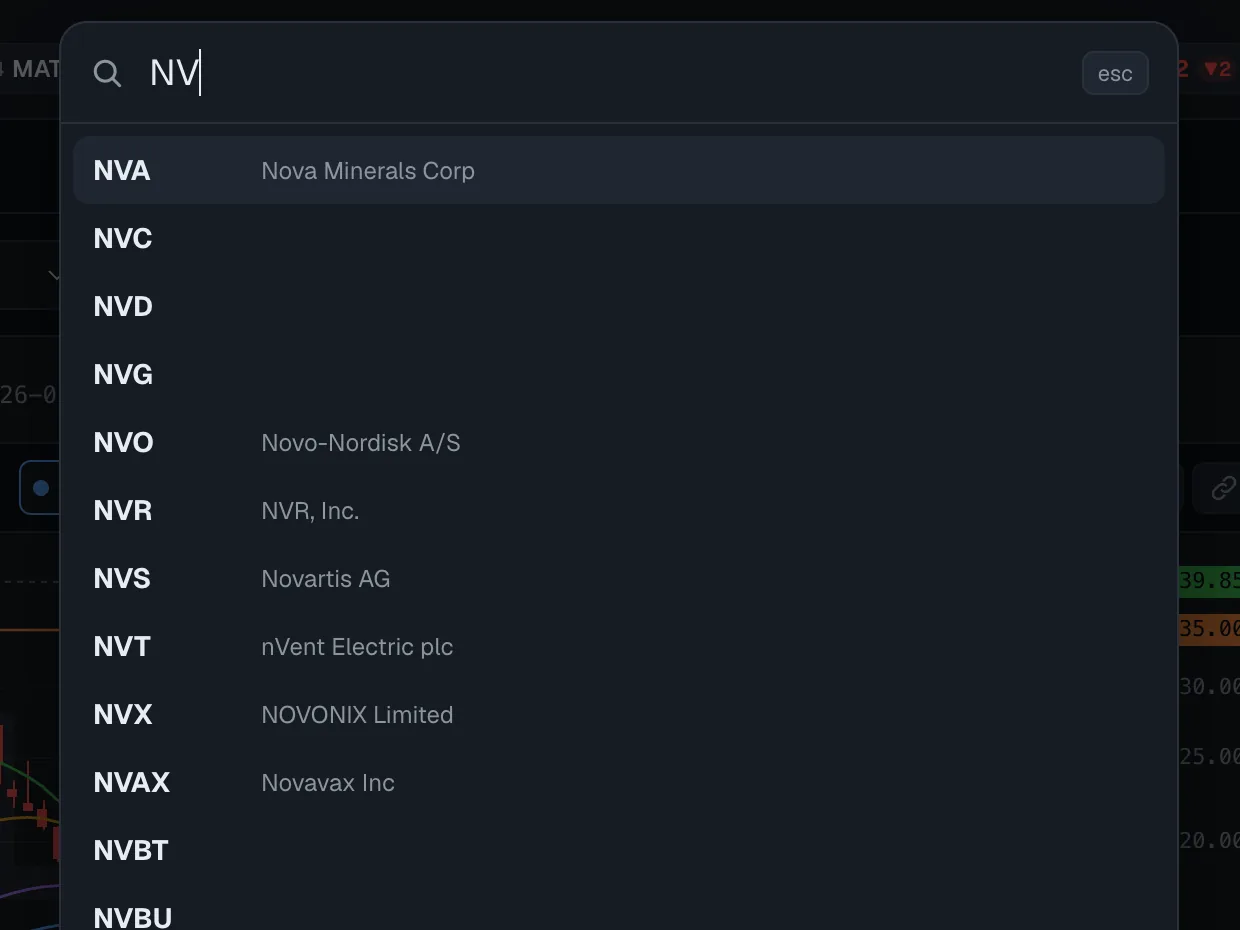
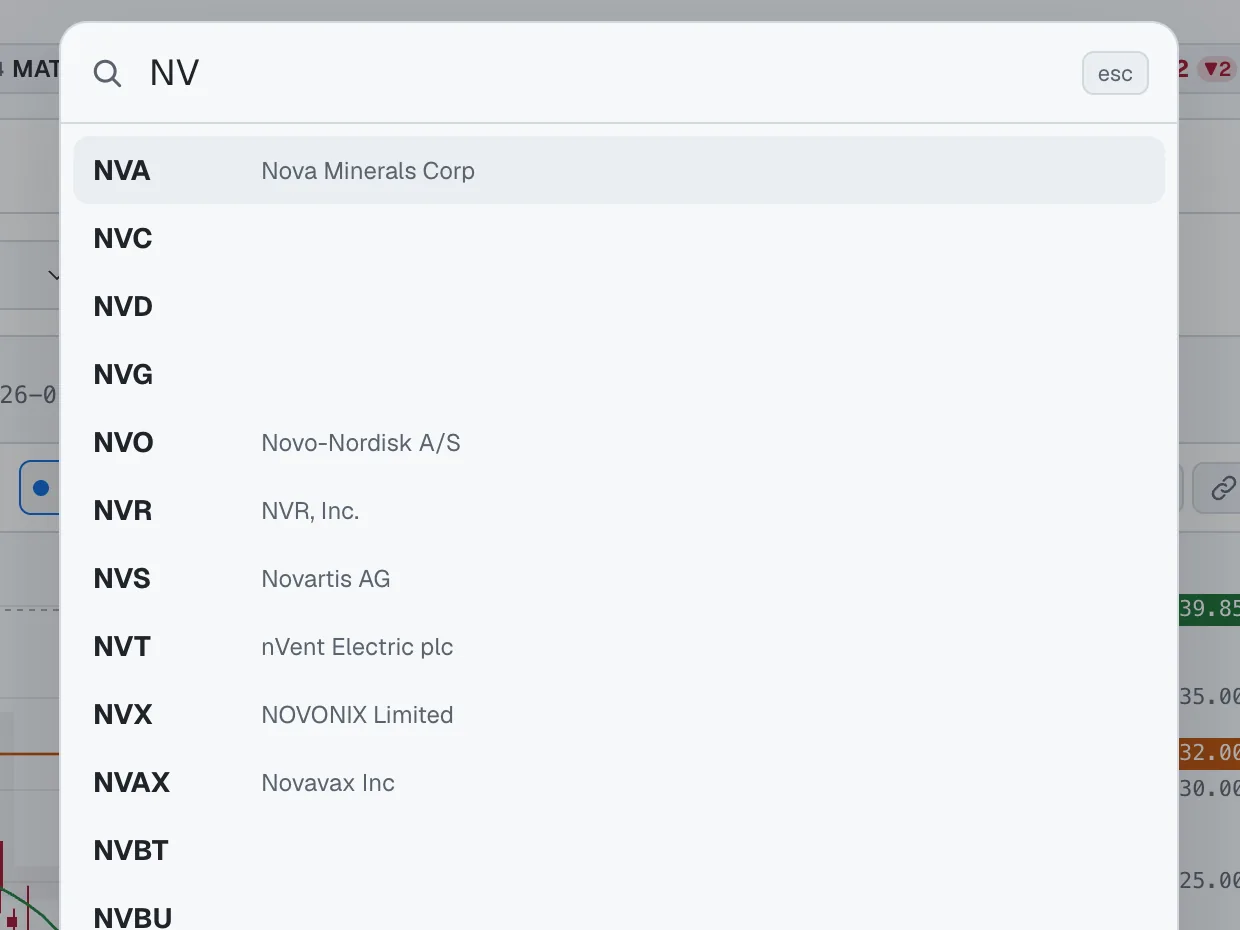
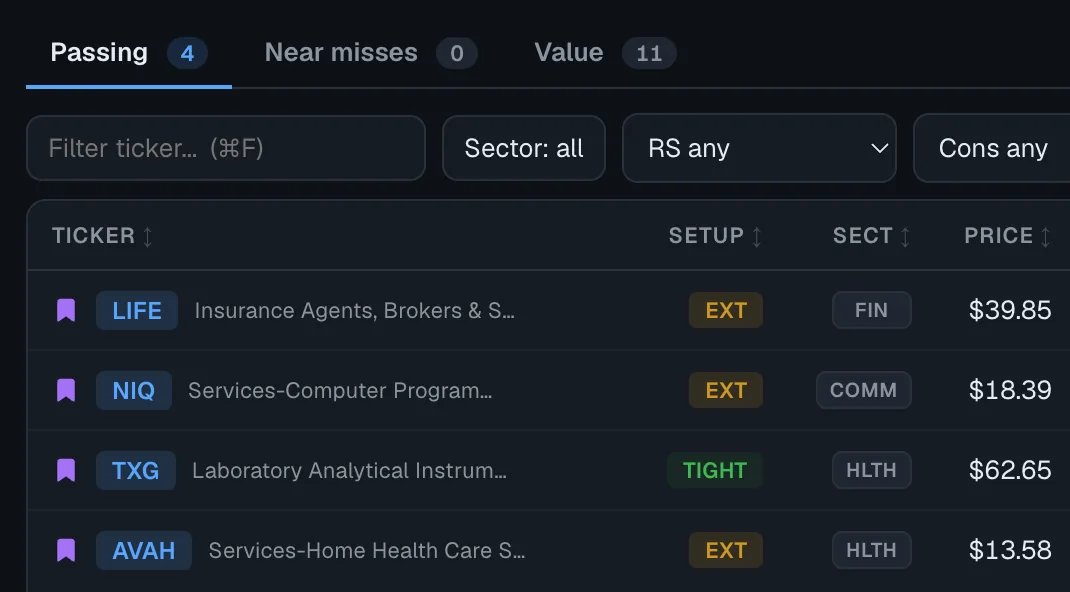
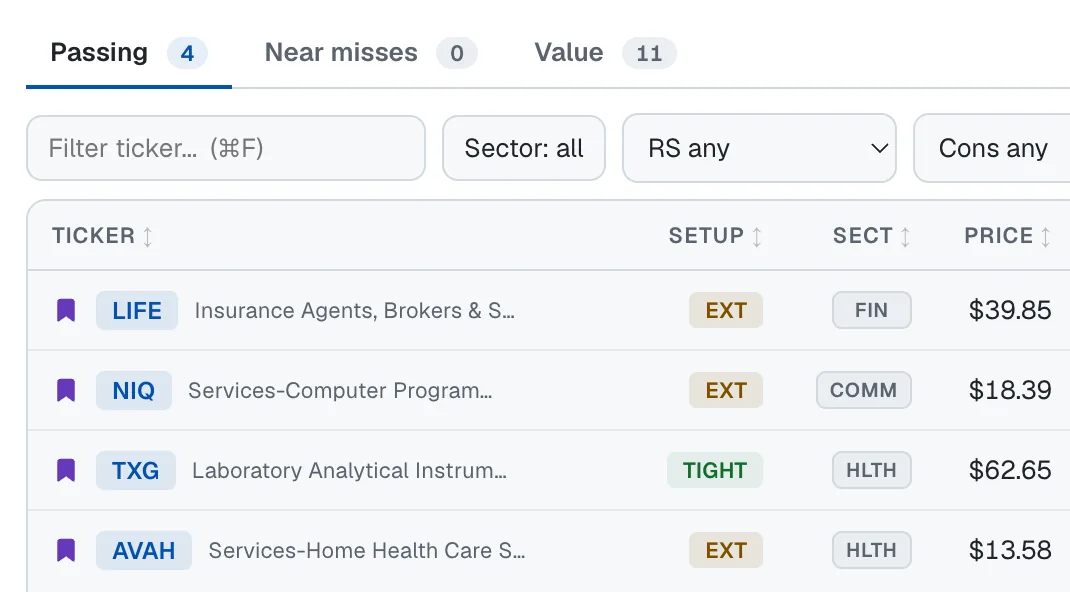
Bookmark a name into your watchlist. It stays with your account across days and devices, and the table can filter down to it.
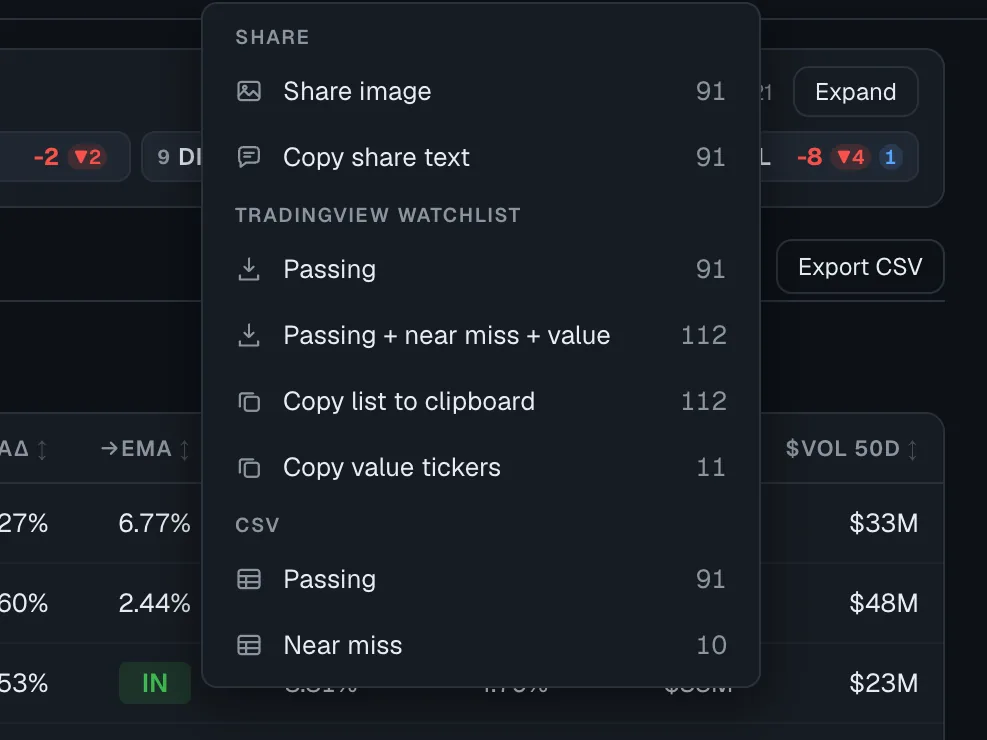
Export a TradingView watchlist, a CSV, a PNG of the table or share text, from the filtered list or the full one.
05Daily digest
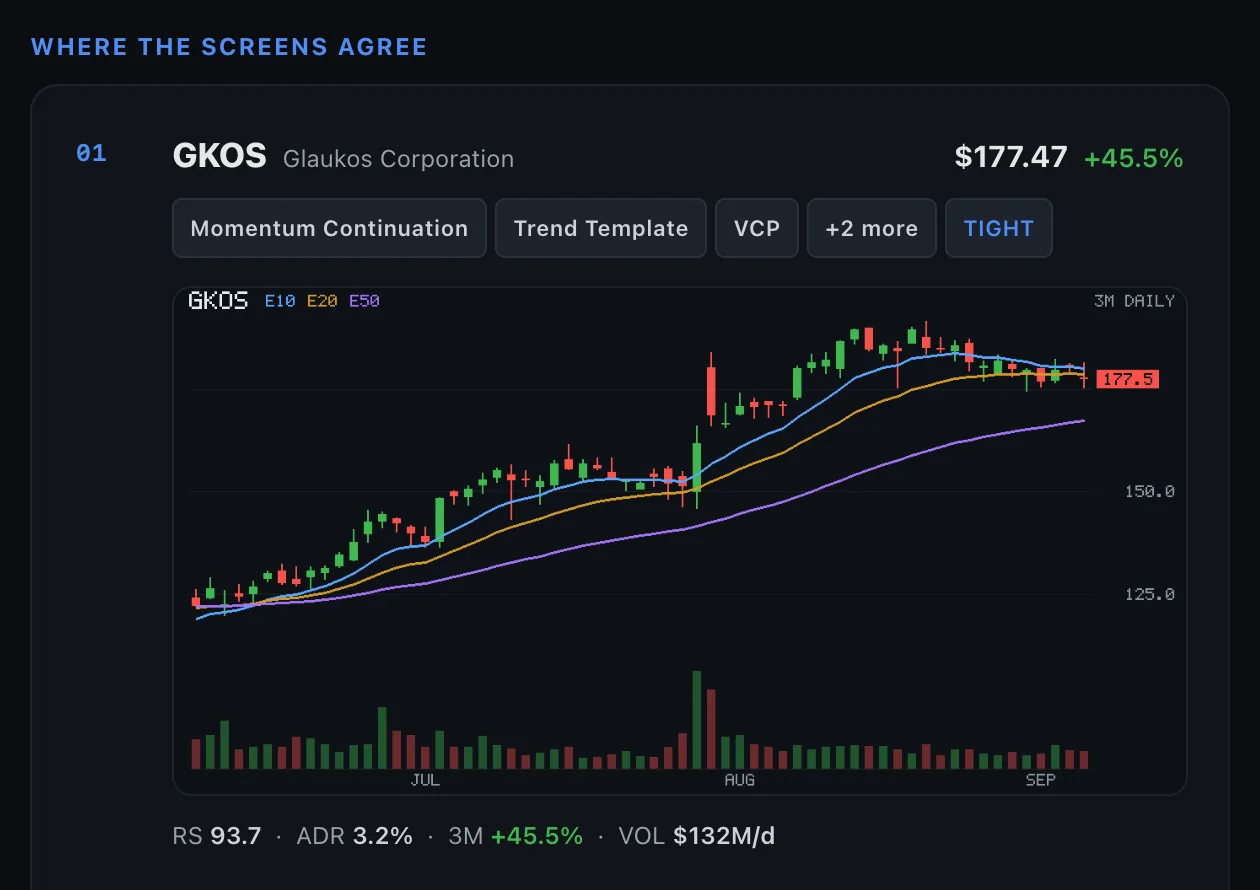
Subscribers get a digest each trading day after the close. It opens with the three stocks that passed the most screens, each with its numbers and a chart of its 10, 20 and 50-day EMAs. Every issue has an unsubscribe link.
06The six screens
Each screen follows a published trend or momentum method and reruns after every US close. A stock can pass one screen and fail the other five.
Liquid US stocks in the top 7% of relative strength (above the 93rd percentile), trading above the 50-day moving average and moving enough each day to be worth a swing trade.
A published eight-point trend checklist. Price is above the 50-, 150- and 200-day simple moving averages (SMA), the averages are stacked 50 over 150 over 200, the 200-day is rising, price is within 25% of its 52-week high and at least 30% above its 52-week low, and the RS rank is 70 or better.
The price range tightens from 30 days to 15 to 5 while volume dries up, with price above the 50-day moving average.
Stocks that opened at least 4% above the prior close on at least twice their 50-day average volume, while already above the 50-day moving average.
Liquid stocks above both the 50-day and 200-day moving averages, with an RS rank of 70 or better and an average daily range between 3% and 8%.
Staples, healthcare and utility stocks above the 200-day moving average that swing less than the market (one-year beta against SPY under 1.0).
07What the screens test
Five measurements decide almost every row on this site.
Relative strength comes first. Each stock's three-month return is ranked against the whole screened universe and reported as a percentile, with SPY's own three-month return printed beside the list as the benchmark. A reading of 97 means the stock outran 97 percent of the market that quarter.
Average daily range, written ADR%, is the mean of each day's high divided by its low, minus one, over the last 20 sessions, as a percent. A name that travels half a percent a day cannot pay for a swing trade's risk, so a floor sits under it. Dollar volume is the liquidity check: price times volume, averaged over 50 days and over 20 days, keeps out names you can get into and not out of.
Then the trend itself. Price above the 50-day moving average, with the shorter averages stacked above the longer ones, separates a stock in an advance from one bouncing inside a downtrend.
The fifth is distance from the highs. Near its 52-week high a stock has no overhead supply left, which is why momentum traders look there. The Trend Template screen tests it outright: price within 25 percent of the 52-week high and at least 30 percent above the 52-week low.
A stock 60 percent above its 50-day average is strong, and it is also late. The setup tag on each row says which kind you are looking at. The long version is in the guide on how to screen for momentum stocks.
08For agents
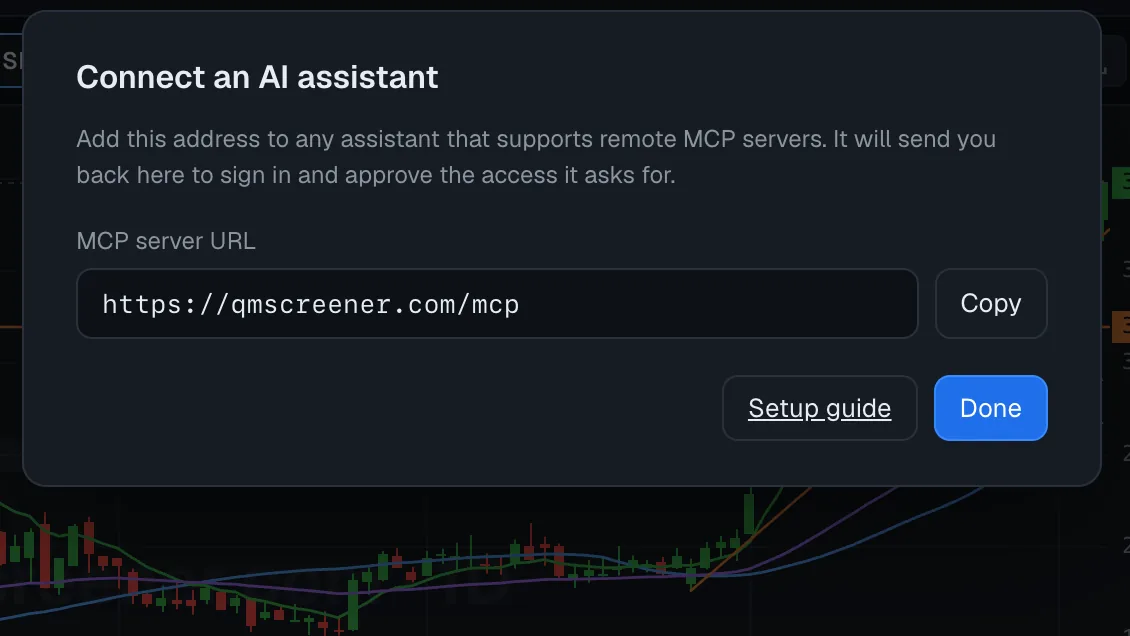
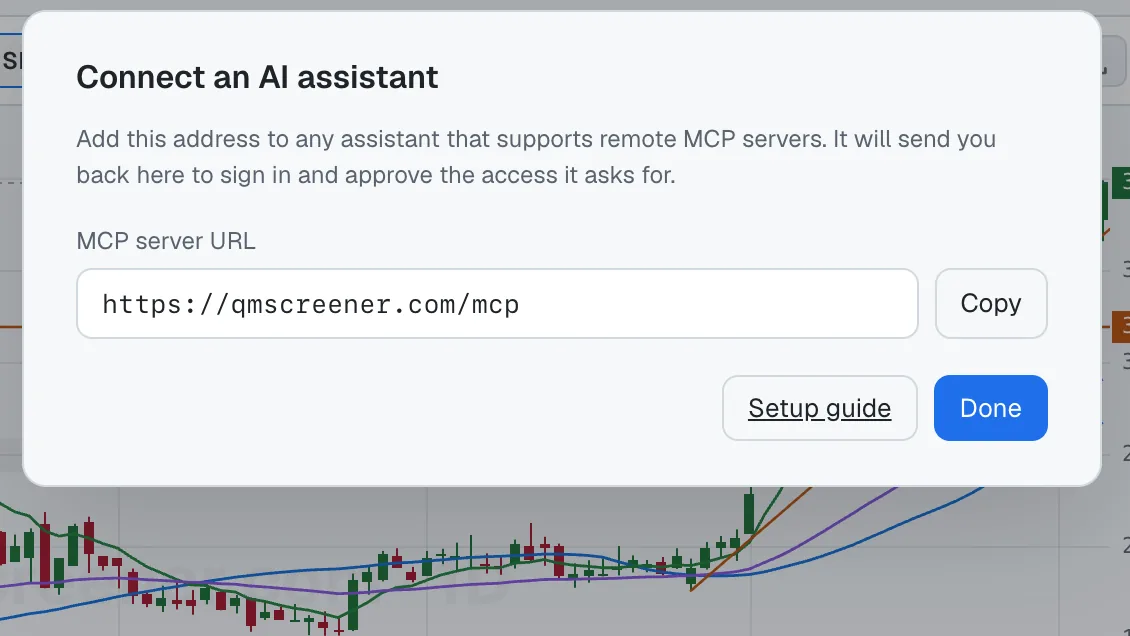
Add one URL to Claude, ChatGPT or any assistant that supports remote MCP servers. It can then read today's setups and the sector ranking, and on a subscriber account every passing name and its chart data. Scripts can use the REST API, which serves the same data. See /docs.
09Pricing
Free screeners like Finviz give you a filter builder. You set up the scans and keep them working. Here the six screens are built and rerun for you, with a setup tag and a chart on every row. What you pay for is the hour each evening you would otherwise spend building scans and paging through charts. One paid tier: $10 monthly or $84 annually after the 7-day trial. A free account (verified email, no card) shows the top 5 names on each screen, with their charts.
Monthly
$10 / month
Billed monthly after a 7-day free trial.
Annual
$84 / year
$7/month, billed yearly. 7-day free trial.
10How we compare
One page per tool, on what it takes to get from the close to a watchlist for the next session.
11FAQ
A momentum stock screener ranks stocks by how strongly they have been moving and filters the market down to the ones in an active advance. QM Screener does that once per trading day over the full US market. Each stock's three-month return is ranked into a percentile against every other screened stock, then checked against a floor on average daily range, a floor on dollar volume, and its position against the 50-day moving average. The names that pass open as charts built from the same end-of-day bars the screen used.
Five things: relative strength against the rest of the market, enough average daily range to be worth trading, enough dollar volume to get in and out, price above the 50-day moving average, and distance from the recent highs. The momentum continuation screen here uses an RS percentile above 93, ADR above 2.50%, 50-day dollar volume above $20M, 20-day dollar volume above $10M, and price above the 50-day SMA, with pharmaceuticals and biotechnology excluded. Every comparison is strictly greater-than. The full method is in the guide.
Yes. A free account needs a verified email and no card. It shows the top 5 names on each of the six screens every day, with their charts. The daily top-setups preview and the sector strength ranking are public and need no account at all. The full passing lists, the near-miss list, charts for any other symbol, symbol search, the watchlist, and the CSV and TradingView exports are $10 a month after a 7-day free trial.
Finviz and TrendSpider give you a filter builder: you pick the fields, set the thresholds and keep the scan working yourself. QM Screener runs six finished end-of-day screens with published rules. Every row comes with a chart drawn from the same bars the screen used, and a setup tag that says whether the stock is basing or already extended. You give up flexibility and get a shorter path from the close to a watchlist. See the Finviz comparison and the TrendSpider comparison.
Anyone. Enter your email and we'll send you a link to set a password, or sign in with Google. A free account needs a verified email and no card, and shows the top 5 names on each screen with their charts. The full lists need a subscription or a running 7-day free trial.
Both plans start with a 7-day free trial on a new account, with full dashboard access from the start. Stripe takes your card when you start the trial but does not charge it until the trial ends. Cancel during the trial and you pay nothing.
In the dashboard, open the ⋯ menu and choose “Manage billing”. That opens the Stripe Customer Portal, where cancelling takes one click. Cancellation takes effect at the end of the current billing period, and you keep access until then.
No. The 7-day free trial is the time to decide. Once a paid period starts, charges are non-refundable for any reason. You can cancel anytime to stop the next renewal. The Terms of Use have the full refund policy.
A commercial US equities data API delivers daily OHLCV bars and basic reference data. Results are persisted between runs so each screen stays reproducible.
A scheduled job re-runs every screen once per trading day after the US close. The dashboard header says which session's close the current names come from.
Yes. Click any ticker to open a candlestick chart drawn from the same end-of-day bars the screen used: daily or weekly candles, volume, a log axis, SMA 50 and 200, and three EMAs (9 / 21 / 50 by default; the periods are editable). Chart view docks the chart beside the result list so you can step through every passing name with the arrow keys, and the URL carries the open chart, so any view can be shared as a link. Your chart settings are remembered between visits.
Every passing and near-miss row is tagged BASE, TIGHT, TREND (trending), EXT (extended) or PARA (parabolic). The tag comes from a consolidation score, which measures how tightly the 10, 20 and 50-day EMAs are bunched and how close price sits to them, in units of the stock's own average daily range. The score is read together with the distance above the 50-day SMA. BASE and TIGHT are the buy-ready setups. PARABOLIC flags a stock late in its move. A one-click preset filters each list to the tags you trade.
No. It lists tickers that pass published momentum filters. It does not recommend trades or size positions, and it knows nothing about your risk tolerance. Use the output as a starting point for your own research.
Each one follows a different published trend or momentum method. A stock can pass one screen and fail the other five. Stocks that pass several screens at once are often worth a closer look, and the daily digest leads with them.
No. QM Screener is an independent product and is not affiliated with, endorsed by, or sponsored by any trader, author, or firm. Each screen implements trend and momentum criteria that are publicly documented. The exact rules are listed in the docs, and each row shows the numbers it passed on, so you can check it yourself.
Yes. Export any list as a TradingView watchlist (one click, ready to import), CSV, a PNG of the table, or share text for a chat or a post. Bookmark names into a per-account watchlist to carry them across days. Programmatically, each screen's full result set is served as JSON over the REST API.
Yes. An MCP server at /mcp exposes the screens as tools for Claude, ChatGPT and any other assistant that supports remote MCP servers. Add the URL, approve it, and the assistant can read the screens for you. Scripts get a REST API, described by an OpenAPI 3.1 document at /openapi.json and versioned at /api/v1. /llms.txt summarises the site for language models, and an agent acting for a subscriber authenticates with OAuth 2.1. The daily top-setups preview and the sector strength ranking are public and need no account at all.
7-day free trial · $10/month after · cancel anytime
Start free trial