
How to Screen for Momentum Stocks: Criteria, Setups, and a Daily Routine
A momentum stock screener ranks listed stocks by how strongly they have been moving, then filters that ranking down to the names in a live advance. It turns several thousand tickers into a list short enough to chart by hand before the next open. This guide covers the five measurements momentum screens are built from, the default thresholds QM Screener uses, how to tell a stock that is strong from one that is ready to buy, and what an end-of-day routine looks like.
What a momentum stock screener is
Momentum screening rests on one observation: over a horizon of a few months, stocks that have outperformed tend to keep outperforming for a while longer. A screener puts a number on that. It measures each stock's return over a fixed lookback, ranks that return against the rest of the market, and keeps the top slice. Everything else a momentum screen does is a filter on tradability. Is the name liquid enough to get in and out of. Does it move enough to pay for the risk. Is it above its own moving averages rather than bouncing inside a downtrend.
The output is a starting list, not a trade list. A screen cannot see an earnings date, a secondary offering, or the reason a stock gapped. What it can do is make the search reproducible: the same rules over the same bars produce the same names, and every row carries the values that admitted it. QM Screener runs six such screens over the full US equity market after every trading-day close.
The five criteria that matter
Relative strength percentile
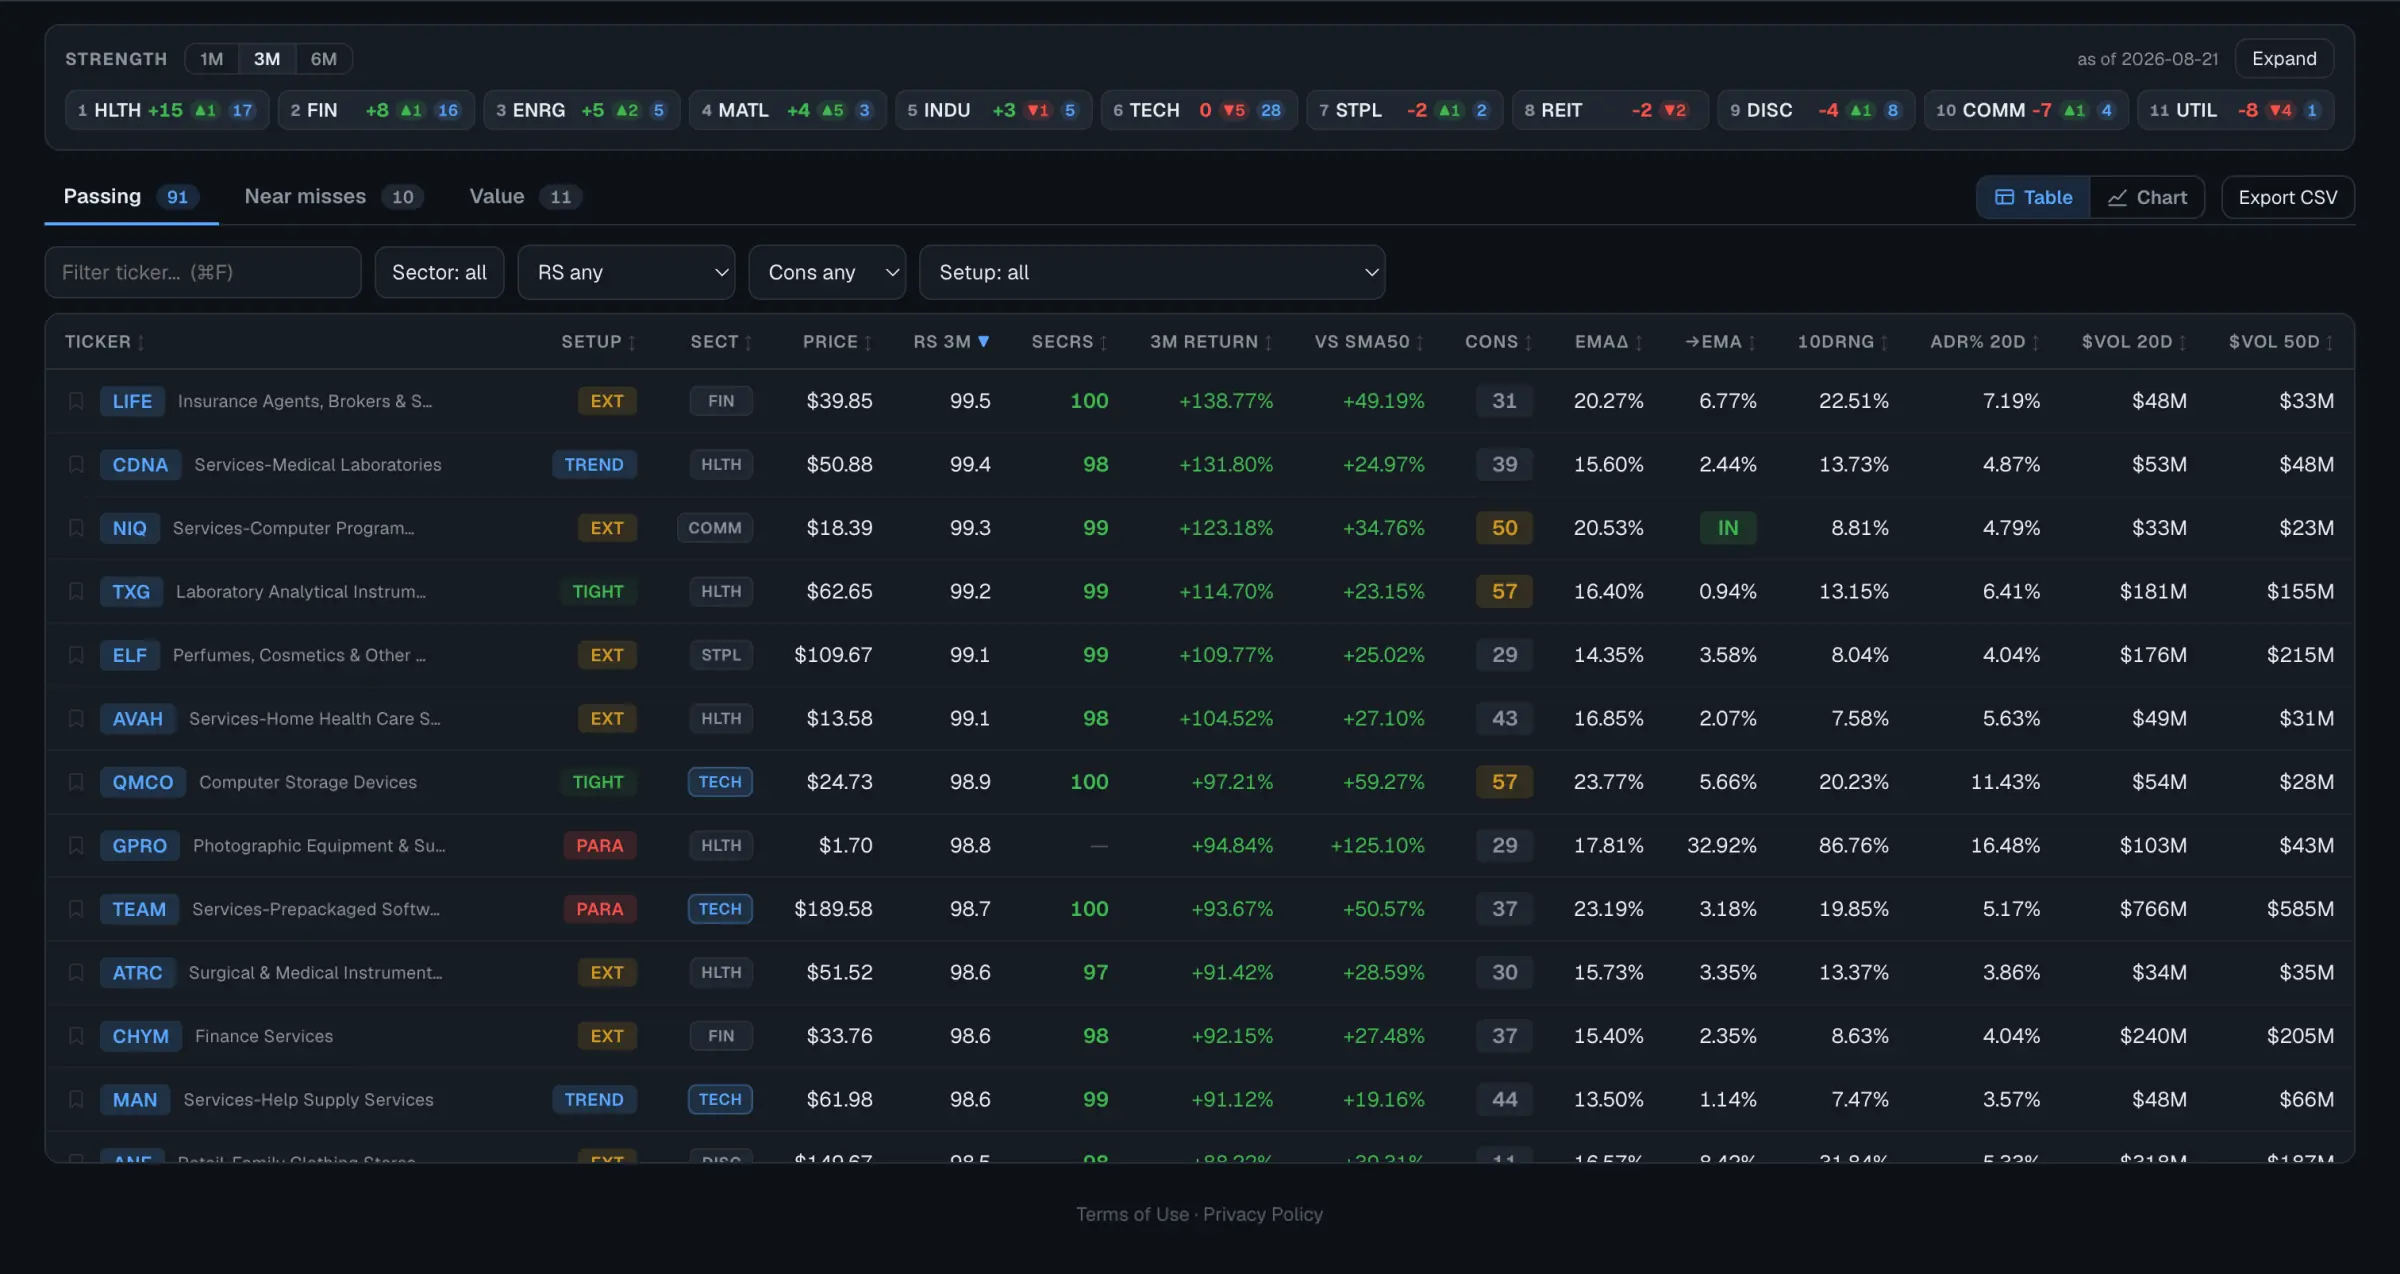
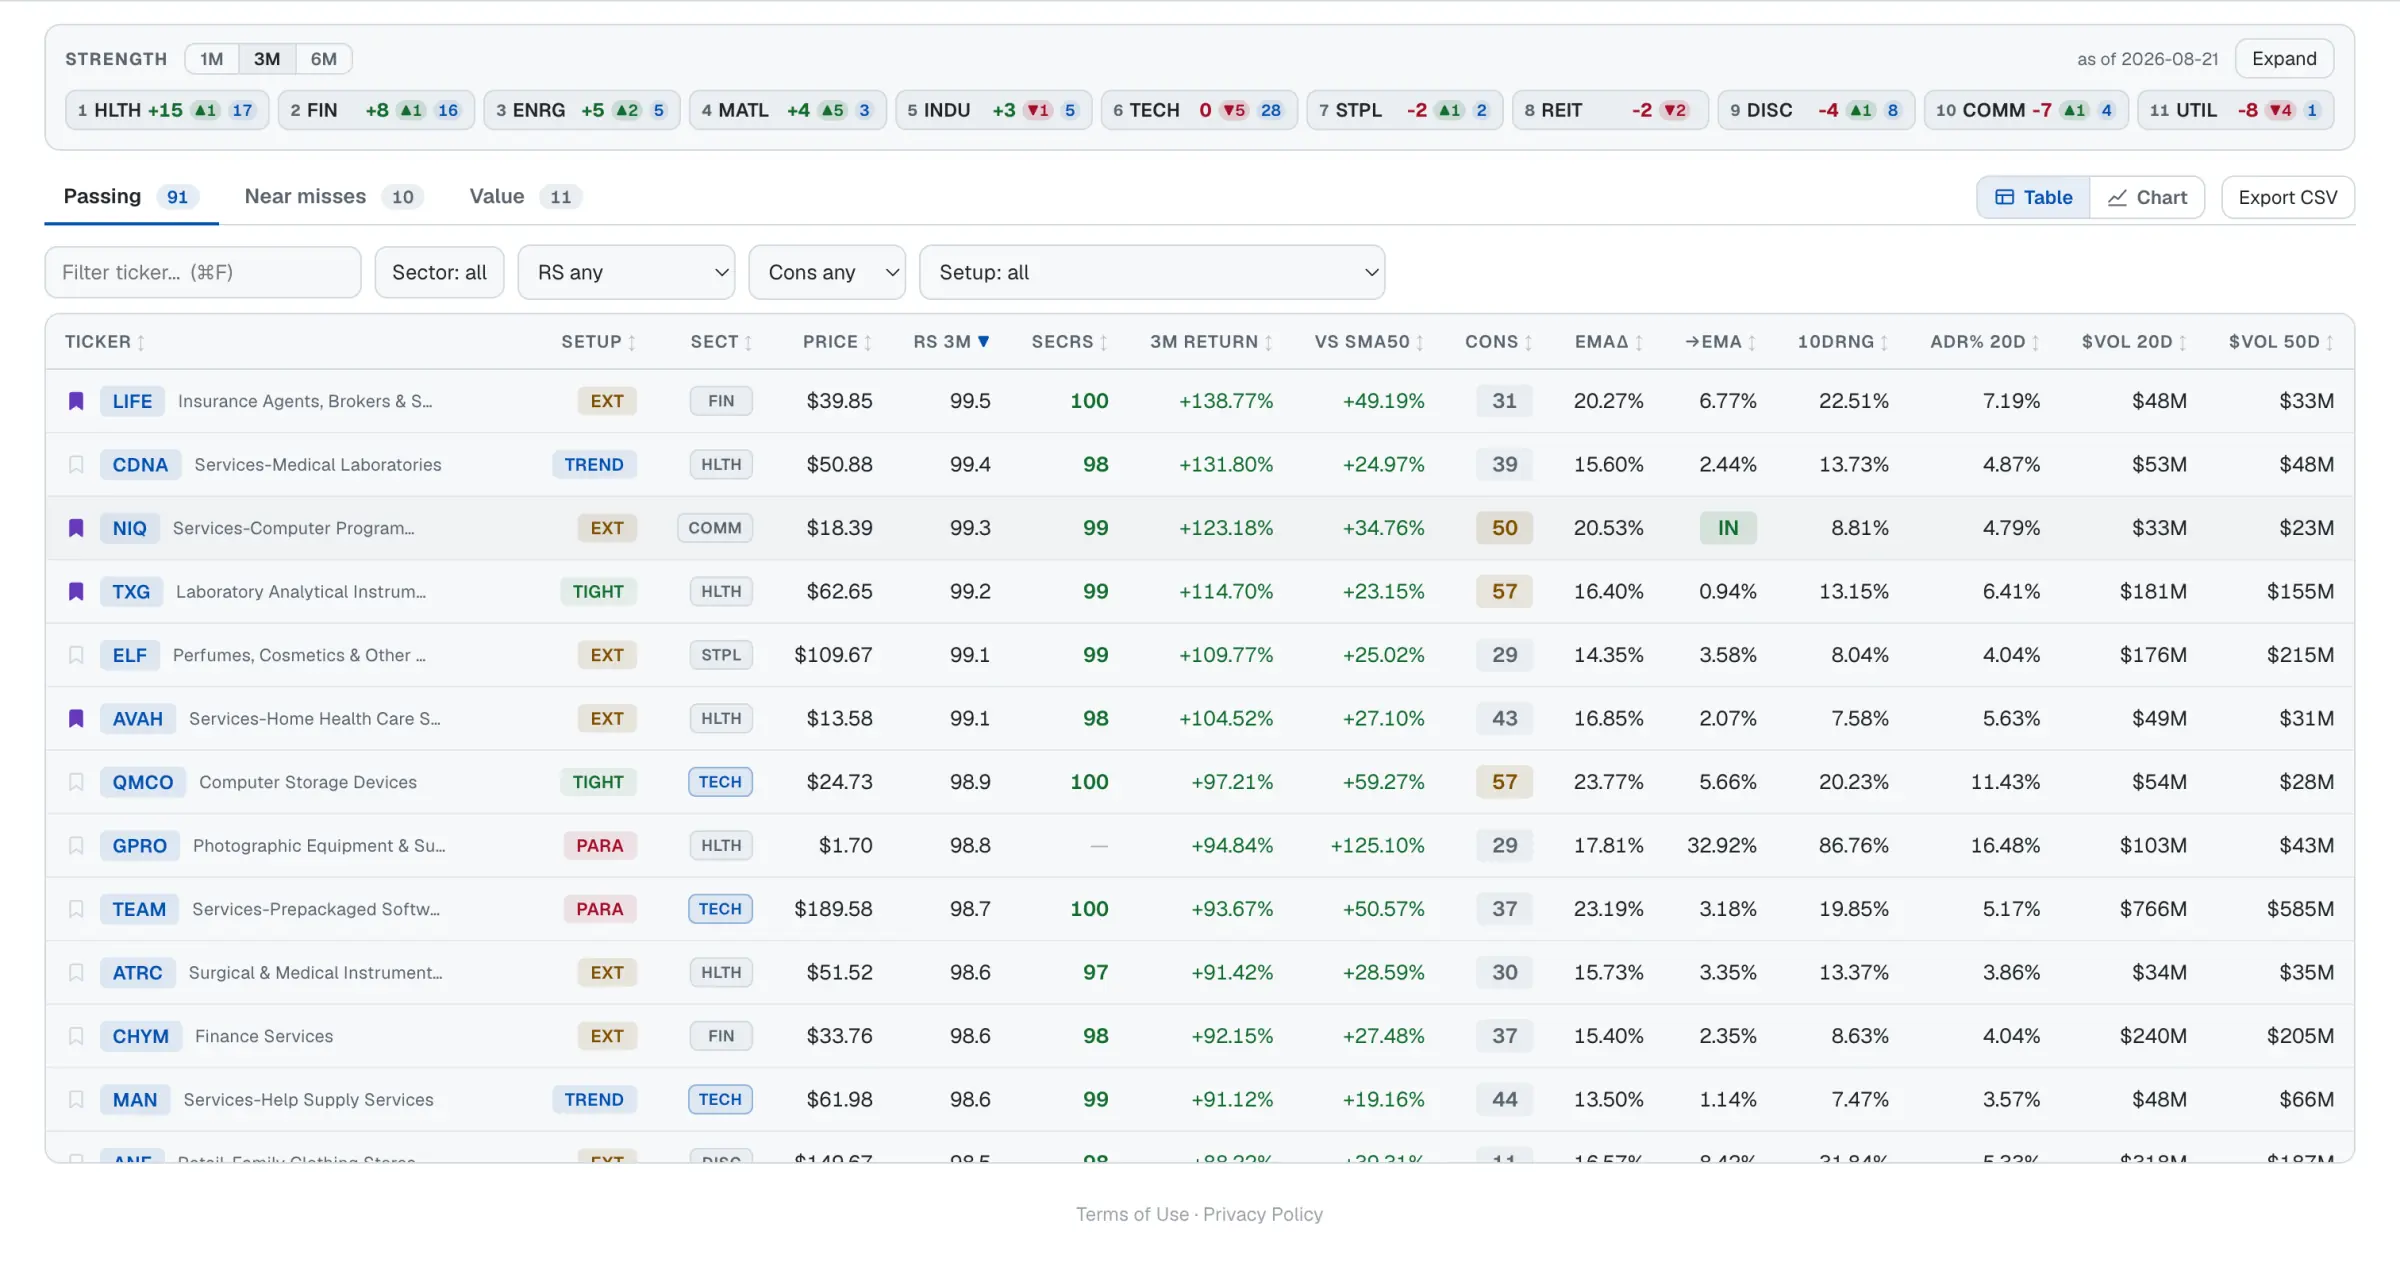
Relative strength is the ranking itself, and it is the one criterion a momentum screen cannot do without. Each stock's three-month return, measured over the last 63 trading days, is ranked against every other name in the screened universe and reported as a percentile from 0 to 100. SPY's own three-month return is written into every result file beside the list, so the market's number sits next to the stock's. A percentile of 97 means the stock outran 97 percent of the screened market over the same quarter.
The default gate on the momentum continuation screen is an RS percentile strictly above 93, so roughly the top 7 percent of the universe. Names that clear every other filter and miss only on relative strength are kept in a separate near-miss list down to the 50th percentile.
Average daily range, ADR%
ADR% is a volatility floor, and it is the criterion most beginners leave out. It is computed as the mean of each session's high divided by its low over the last 20 sessions, minus one, expressed as a percent. A stock with an ADR of 1 percent can be in a perfectly good uptrend and still be a poor swing vehicle: the move you are trading for is smaller than the slippage and the stop you would have to set. The default floor is an ADR strictly above 2.50%. The Swing Momentum screen brackets it on both sides, asking for 3 to 8 percent.
Dollar-volume liquidity
Liquidity is checked as dollar volume, not share volume: closing price times volume, averaged over 50 days and again over the last 20 days. Share volume flatters low-priced stocks, and a 30-million-share day in a two-dollar stock is not a market you can put size into. The defaults are a 50-day average strictly above $20 million and a 20-day average strictly above $10 million. The two windows together catch a name whose liquidity has quietly dried up in the last month while its 50-day figure still looks healthy.
Price above the 50-day average
The trend filter is what keeps a screen from returning strong-looking bounces inside downtrends. At minimum, price must be above its 50-day simple moving average: the default is price strictly more than 0.01% above it, which is a sign test rather than a threshold. Stricter screens stack the averages. The Trend Template screen requires price above both the 150-day and the 200-day SMA, the 150-day above the 200-day, the 50-day above both, and the 200-day itself higher than it was 22 trading days ago.
Distance from the 52-week high and low (Trend Template)
The last criterion is position. A stock near its 52-week high is in the part of its chart where there is no overhead supply, which is the practical reason momentum traders look there. The Trend Template screen wants price within 25 percent of the 52-week high and at least 30 percent above the 52-week low. Distance cuts the other way too: a name far above its 50-day average has already made the move, which is what the setup tags below are for.
Every comparison in the shared filters is strictly greater-than, and pharmaceuticals and biotechnology are excluded from the momentum continuation screen by default, because binary drug-trial moves are not momentum in the sense this screen is measuring.
Strong is not the same as ready
Two stocks can sit at the 99th percentile of relative strength and be in completely different places. One has run 70 percent above its 50-day average in five weeks. The other advanced, stopped, and has spent three weeks going sideways with its averages catching up underneath it. The first is strong. The second is strong and ready.
The measurement behind that distinction is a consolidation score. It reads two things:
- how tightly the 10, 20 and 50-day exponential moving averages are bunched together, and
- how far price is sitting from that bundle.
Both are expressed in units of the stock's own average daily range, so that a 9 percent-ADR leader is judged by its own standard rather than against a utility. The ADR used as the yardstick is capped at 12 percent, which stops a very volatile small cap from scoring well simply because its own range makes everything look tight.
The score and the stock's extension above the 50-day SMA produce one of five tags on every row, first match winning:
- PARABOLIC is at least 50 percent above the 50-day SMA and still covering 3 or more ADRs of range in ten days. The move is live and late, and chasing it is the highest-risk thing on the list.
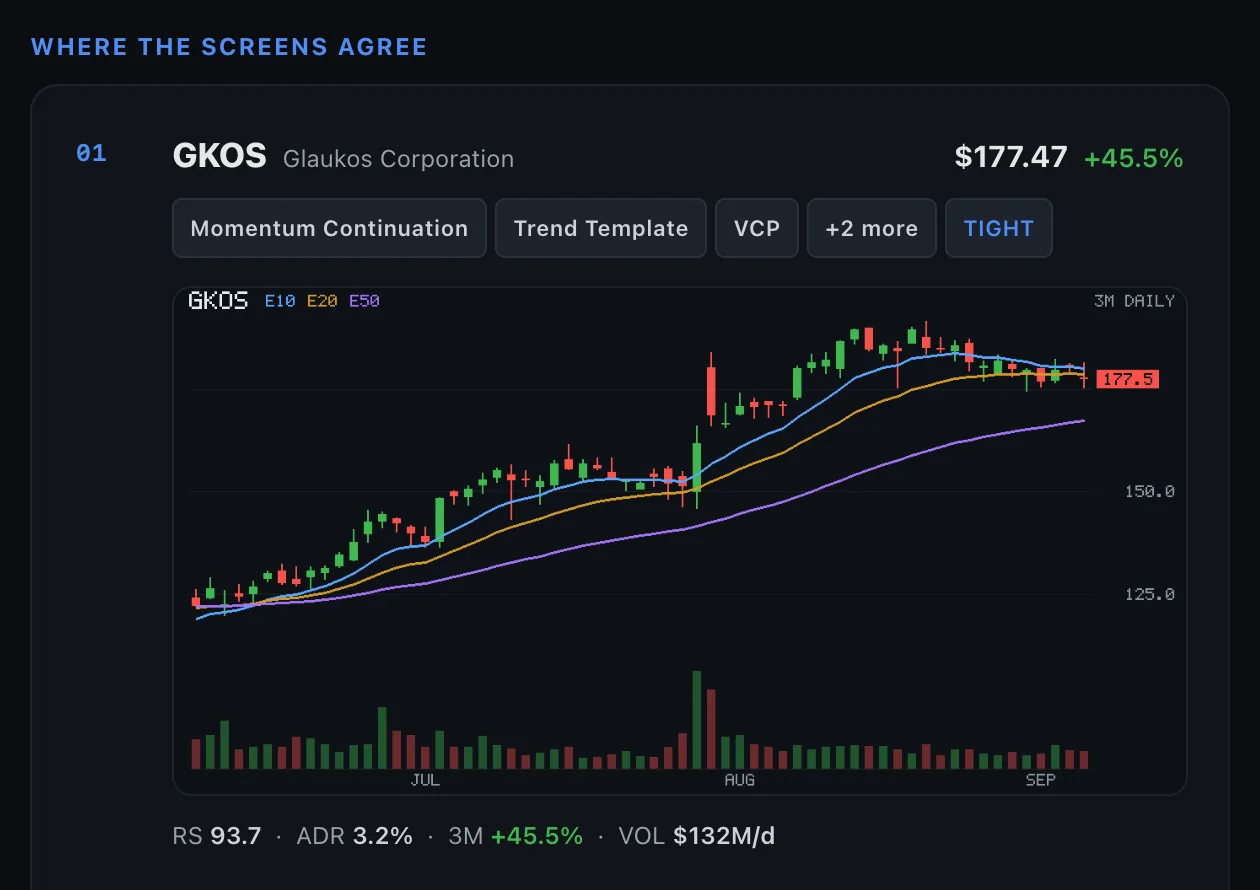
- BASE is a consolidation score of 75 or better with price no more than 40 percent above the 50-day SMA. Tight averages, price sitting on them: the classic buy setup.
- TIGHT is a score of 55 or better without the extension limit. A decent consolidation, worth watching for a breakout.
- EXTENDED is 25 percent or more above the 50-day SMA with no real consolidation. Wait for a pullback or a base.
- TRENDING is everything else. Advancing, no base yet.
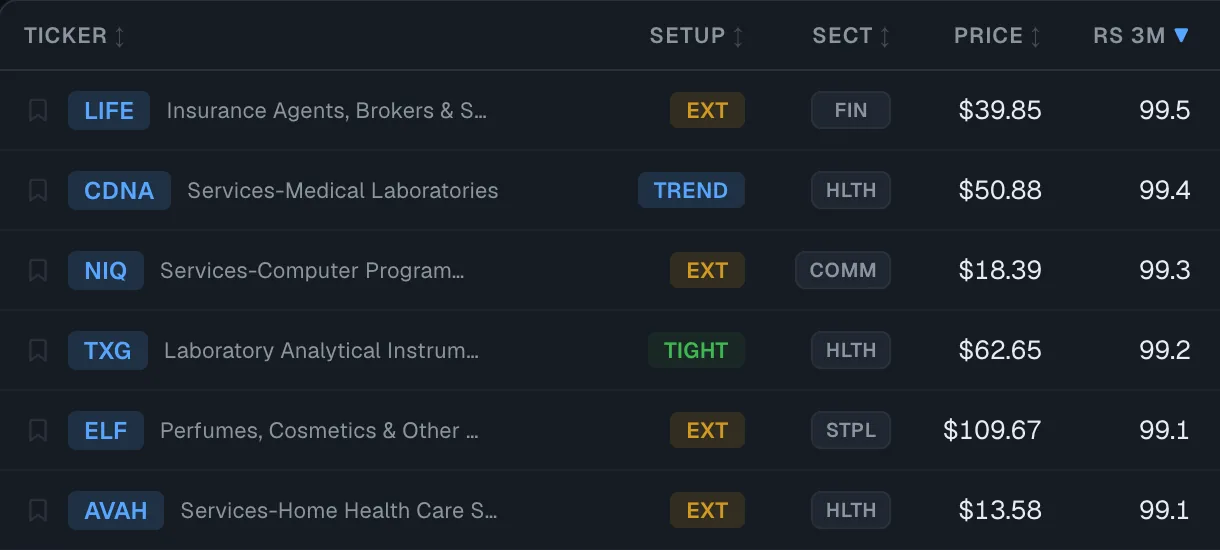
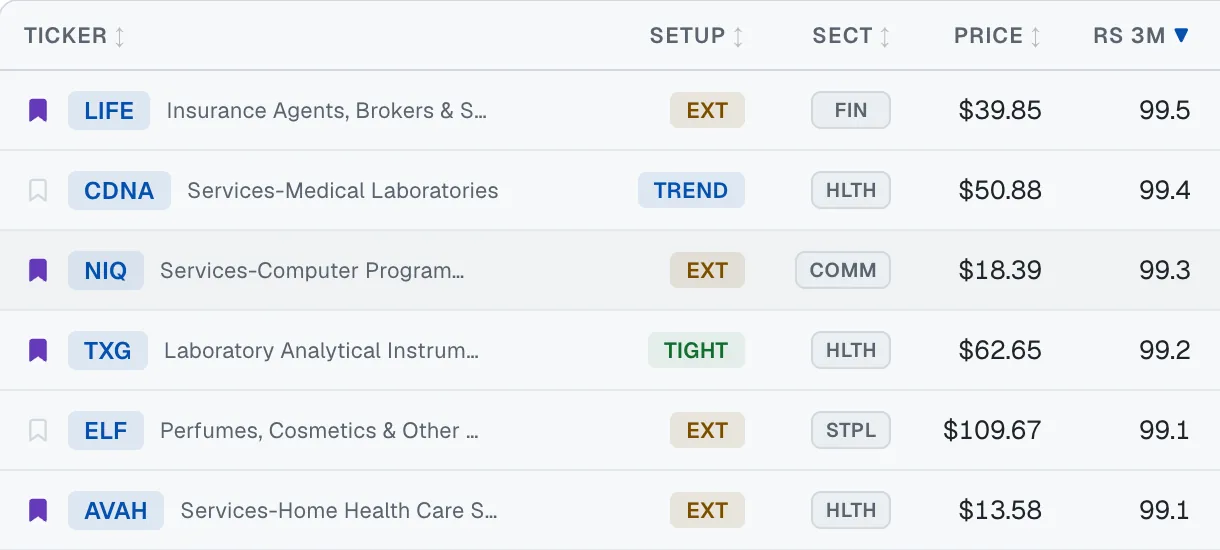
Filtering a screen to BASE and TIGHT is usually the fastest way to get from a passing list of a few hundred names to the handful worth drawing levels on.
Six screens, one data set
All six screens run over the same universe and the same end-of-day bars, and they are complementary rather than redundant. A ticker can pass one and fail the other five, and the overlaps are often the interesting part.
Momentum Continuation is the continuation screen. It applies the shared gates above, so liquid US names with real daily range, above the 50-day average, in the top few percent of three-month relative strength. It answers which of the market's leaders has stopped to breathe.
Trend Template is the eight-point trend checklist described in the criteria section:
- price above the 150-day and a rising 200-day SMA, with the averages stacked 50 over 150 over 200,
- price within 25 percent of the 52-week high and at least 30 percent above the 52-week low, and
- a relative-strength percentile of 70 or better.
It is a confirmation screen rather than a timing one.
VCP looks for the coiling base. It is a heuristic rather than pattern recognition by eye:
- each contraction leg must be at least 1.5 times the next,
- the final 5-day range must be 8 percent of price or less,
- average volume over the last 5 days must be no more than 0.7 times the prior 25 days, and
- price must be above the 50-day SMA.
Volume drying up into a tightening range is the whole thesis, which is why this screen sorts by the final range rather than by relative strength.
Gappers is the event screen. A gap of 4 percent or more from the prior close, volume of at least twice the 50-day average, price above the 50-day SMA, and a liquidity floor. The dashboard's filter marks the 7.5 percent gap level, which is the episodic-pivot threshold many traders use. It sorts by gap size.
Swing Momentum is the middle of the road: dollar volume of $20 million or more, price above both the 50-day and 200-day averages, ADR between 3 and 8 percent, and a relative-strength percentile of 70 or better.
Defensive Strength inverts the question. It looks for names in defensive industries, consumer staples, healthcare and utilities, holding above the 200-day average with a one-year beta against SPY below 1.0, and it sorts by beta ascending rather than by relative strength.
The exact rules for each are on the docs page, and the about page covers how the run is put together and audited.
A daily routine
The screens finish after the US close, and the routine below is the work they are meant to support.
- Open the list. Pick the screen that matches the market you are in. The continuation and trend screens in a healthy tape, the defensive screen when the passing lists start thinning out.
- Sort and filter. Each screen opens on the sort that suits it: relative strength for the momentum screens, final range for the contraction screen, gap size for the event screen, beta for the defensive one. Then set the setup filter to the buy-ready tags and see how many names survive.
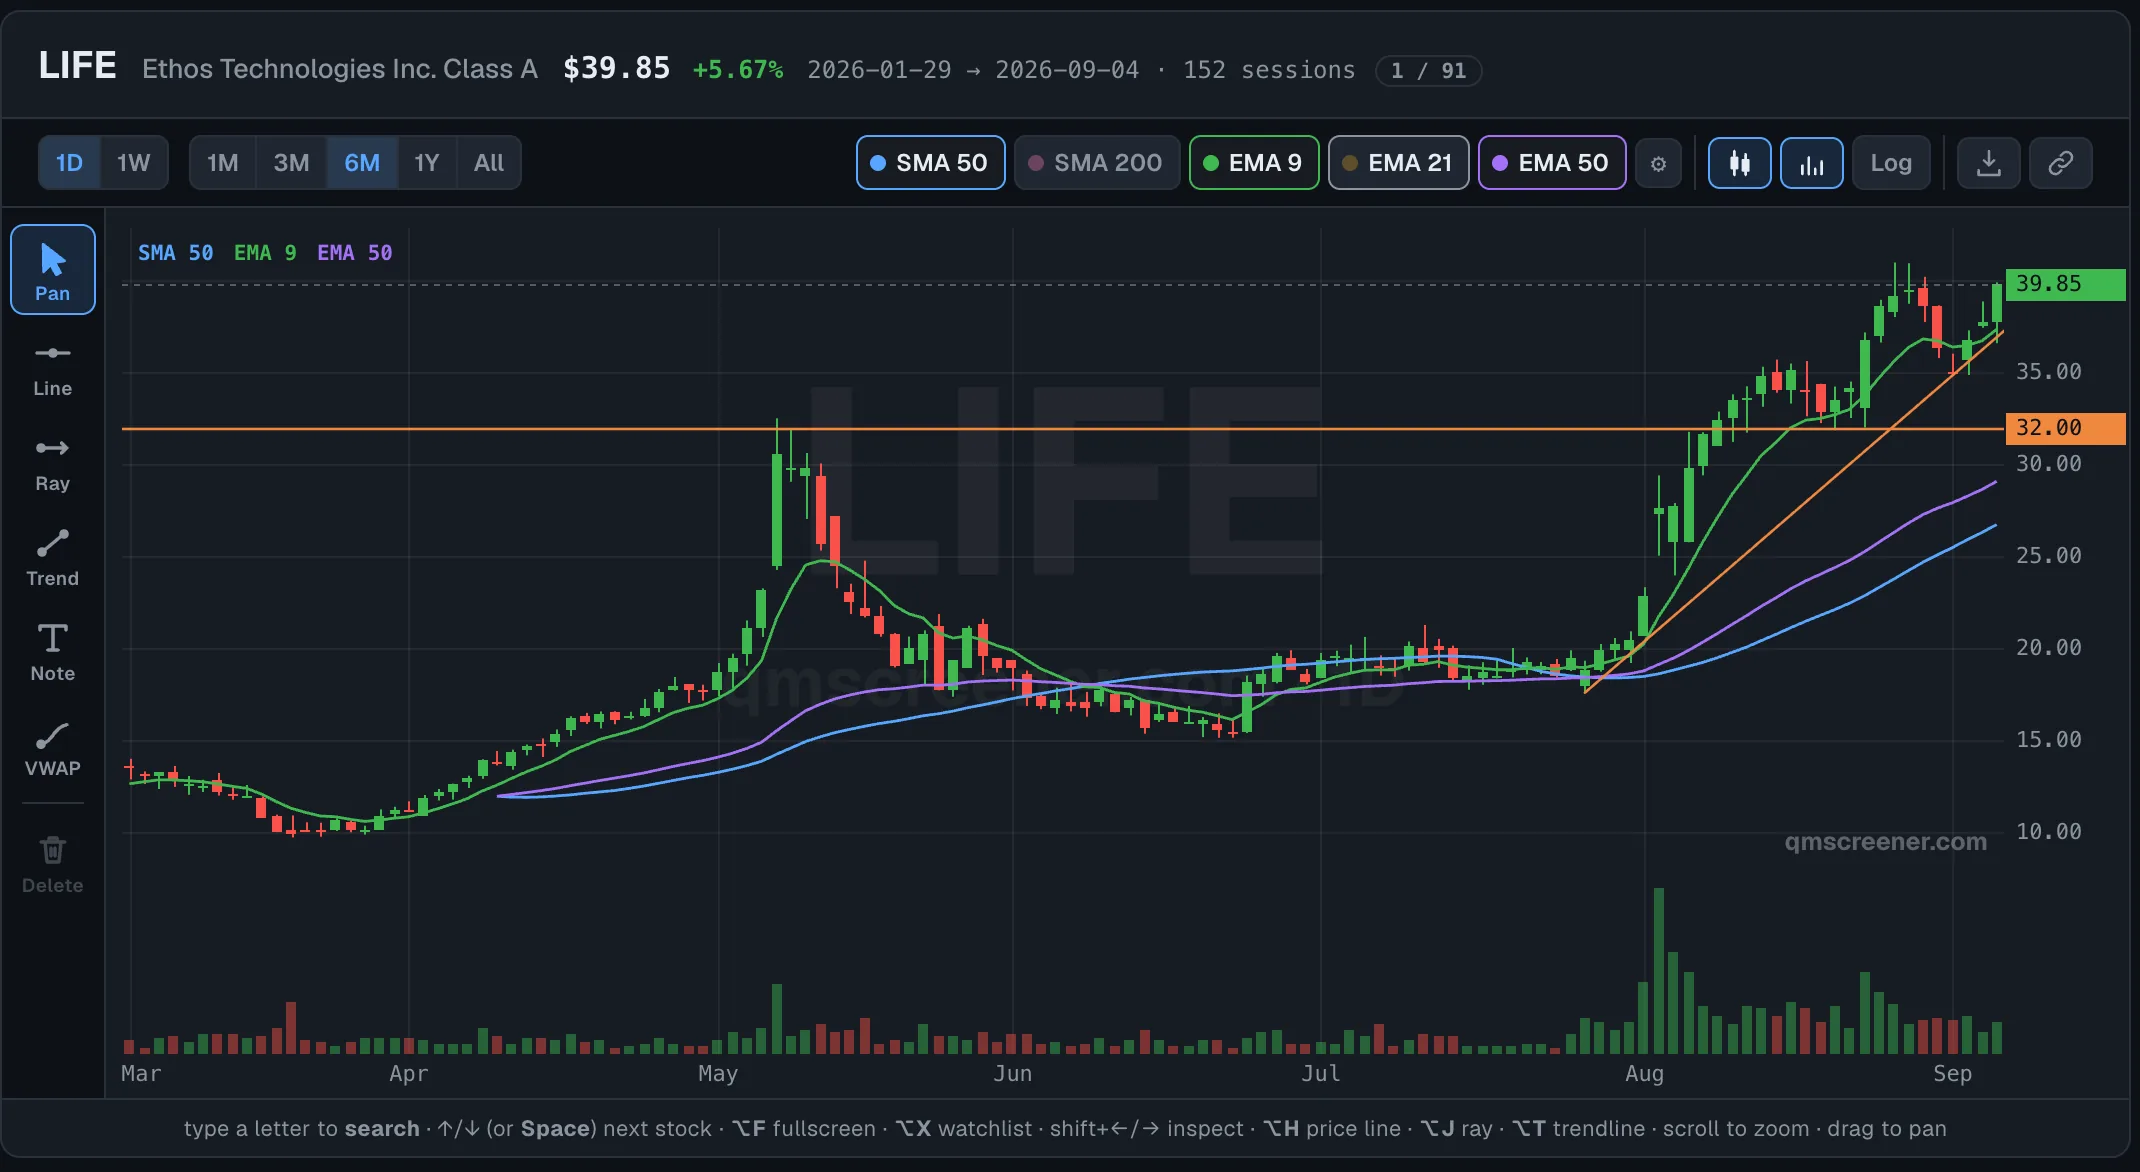
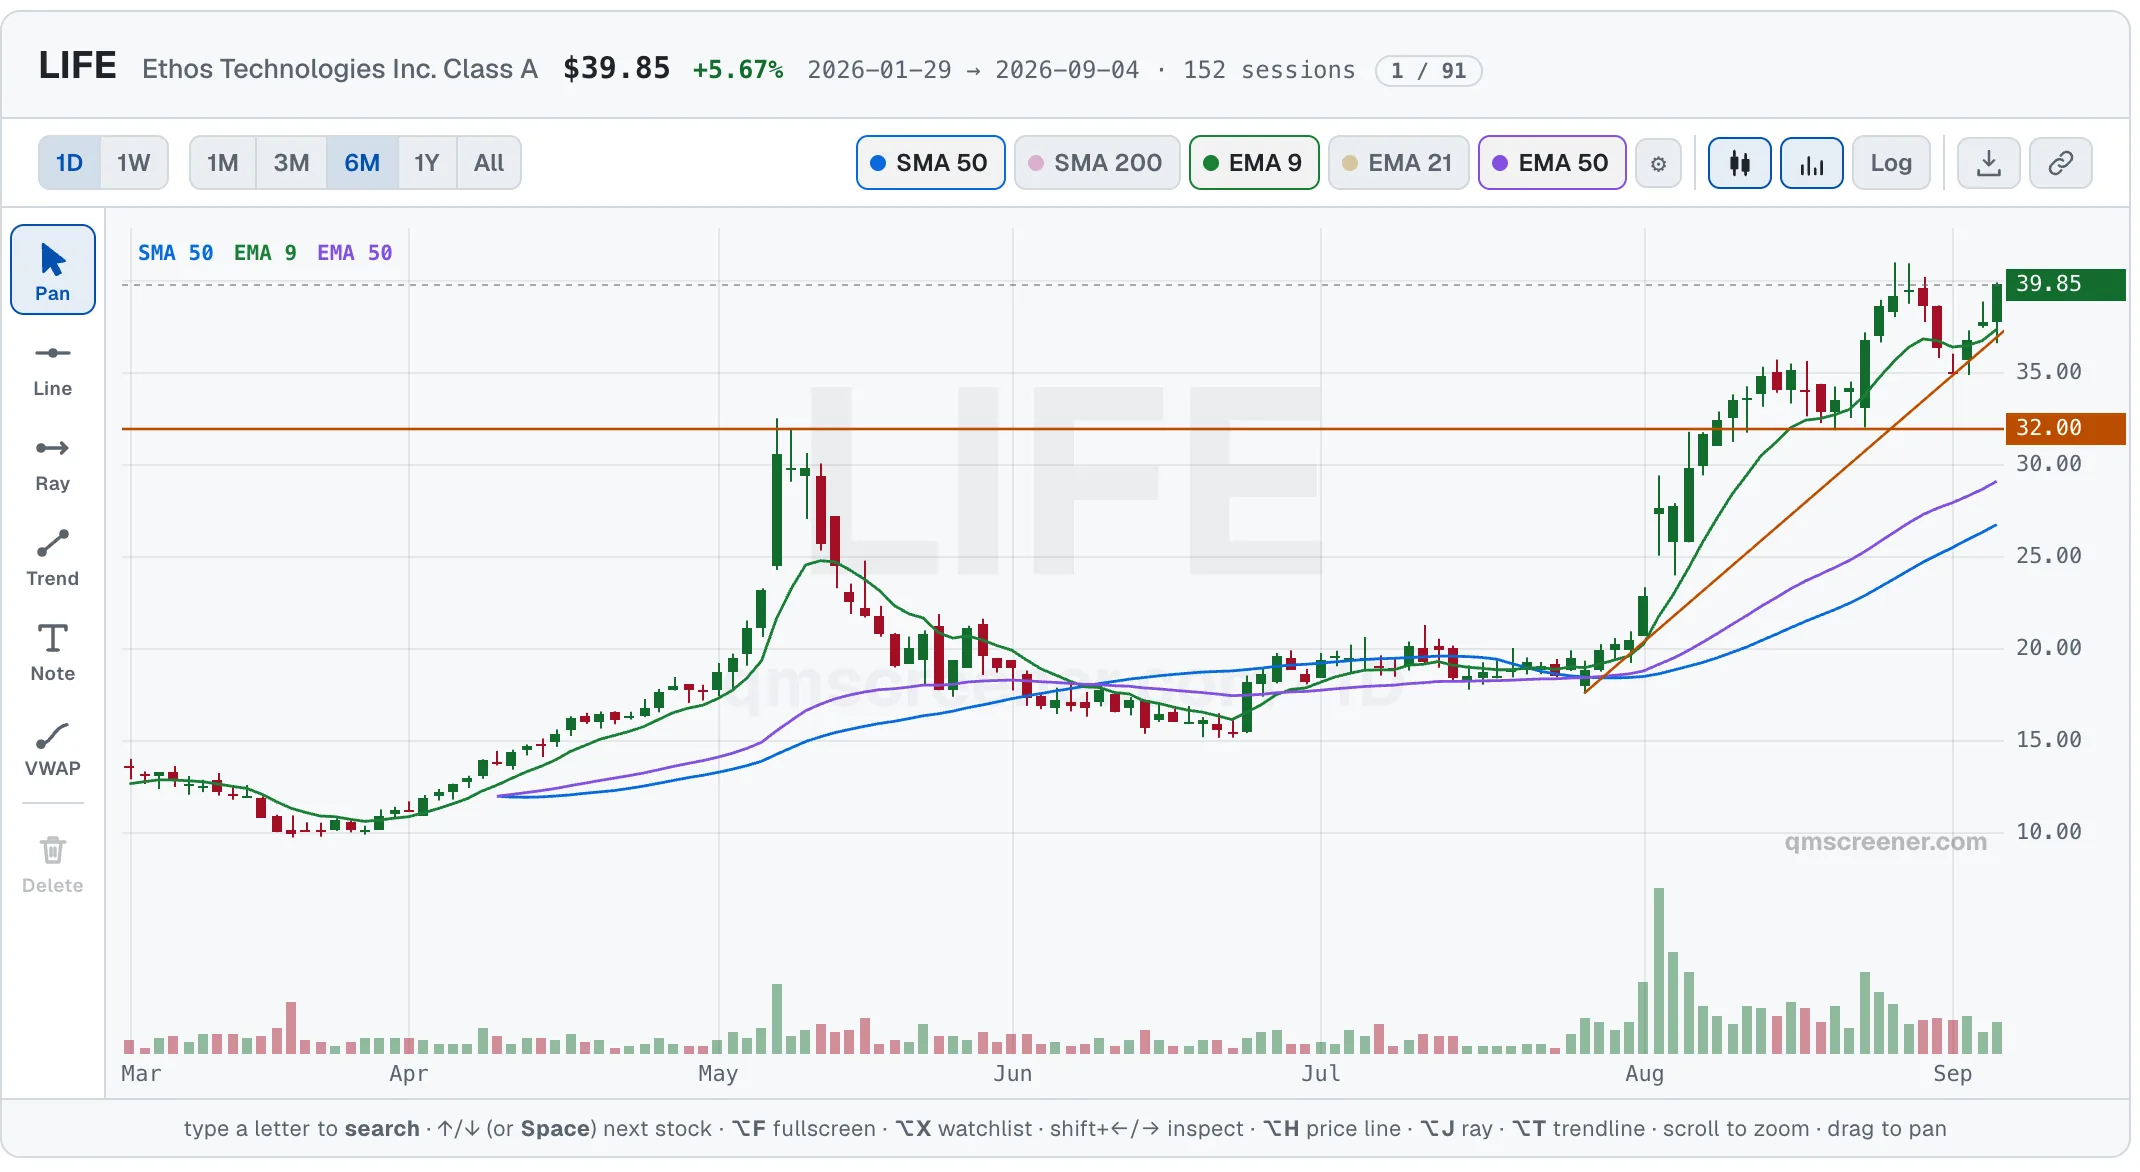
- Chart the survivors. Every row opens a candlestick chart drawn from the same end-of-day data, with the 50-day average already on it. Chart view docks the chart beside the list so the arrow keys step through the names.
- Mark the levels. Draw the pivot, the line you would buy through, and the level that says you were wrong. The drawings are saved per ticker, so tomorrow's chart opens with yesterday's work on it.
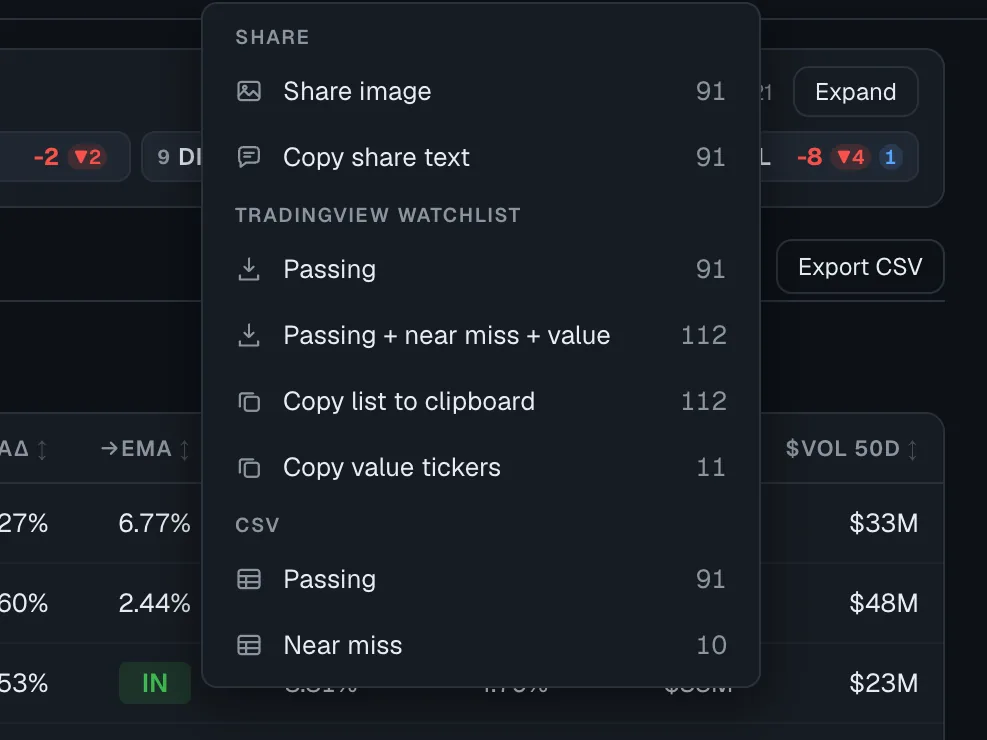
- Save what survives. Bookmark the keepers into the watchlist, which carries across days and devices, and export the rest as a TradingView watchlist, a CSV, a PNG of the table, or share text.
- Read the digest. The optional daily email arrives after the close with the names that cleared the most screens, each with a chart.
Common mistakes
Chasing the extended names. The top of a list sorted by relative strength is frequently the worst place to buy, because the stocks that ranked highest got there by moving the furthest the fastest. That is what the setup tags are for. If a name is tagged EXTENDED or PARABOLIC, the screen is telling you the move already happened.
Ignoring liquidity. A thin stock will pass a momentum screen beautifully and then cost you two percent in slippage on the way in and more on the way out. The dollar-volume floors are not a formality.
Screening intraday. A screen run against a partial session is screening a bar that does not exist yet, and the names it returns will change by the close. Results here are keyed to the newest settled session, so a run started while the market is open screens the previous close.
Treating a screen as advice. A screener lists tickers that passed filters. It does not know your position size, your stop, your other holdings or your timeline, and it has no opinion about whether any of these names should be bought. Nothing on this site is financial advice.
Frequently asked questions
What timeframe does a momentum screen use?
This one ranks three-month performance, measured over the last 63 trading days, and applies its other filters to the most recent 20 to 50 sessions. That is a swing-trading horizon: long enough that a single day's move cannot carry a stock into the list, short enough that the ranking still describes the market you are trading now.
Is QM Screener free to try?
A verified free account on QM Screener sees the top 5 names on each of the six screens every day and can chart them. The daily top-setups preview and the sector strength ranking need no account at all. The complete lists, the per-row values and the exports are $5 a month after a 7-day free trial.
Where does the data come from?
A commercial US equities data API supplies daily open, high, low, close and volume bars plus basic reference data. Bars are cached between runs, so a screen can be re-run and produce the same names. There is no intraday data, no fundamentals and no news.
Do momentum screens work in a bear market?
They keep working and they return fewer names, which is itself information. When the ranking is topped by stocks that are merely falling less than the rest, the passing lists thin out and the setup tags stop saying BASE. The Defensive Strength screen exists for those stretches: it looks for lower-beta names in defensive industries holding above the 200-day average.
How often does the screener refresh?
Once per trading day, after the US close. Each result file records the session it screened, which is the newest settled bar rather than the clock, so a run started during market hours screens the previous close instead of a partial one.
Can an AI assistant read the screens?
Yes. QM Screener runs an MCP server, so Claude, ChatGPT or any assistant that supports remote MCP servers can be pointed at one URL. It then reads the day's setups, the sector ranking and, on a subscriber account, every passing name and its price history. The setup is on the docs page.
Start with today's list
Today's passing names are on the QM Screener dashboard, the leading few per screen are public, and a free trial opens the full lists. If you are comparing tools, the Finviz comparison and the TrendSpider comparison cover where a pre-built methodology helps and where a filter builder is the better instrument.